Time-series K-means clustering
usage: ts_kmeans.py [-h] -f INPUT -t TIME_POINTS [-s SEP] [-n NCLUSTERS]
                    [-m METRIC] [--log2] [--index] [--header]
                    [-o OUTPUT_LABEL] [--transpose] [--scale_t0]

optional arguments:
  -h, --help            show this help message and exit
  -f INPUT, --input INPUT
                        input table (default: None)
  -t TIME_POINTS, --time_points TIME_POINTS
                        input time points (default: None)
  -s SEP, --sep SEP     separator (default: )
  -n NCLUSTERS, --nclusters NCLUSTERS
                        input number of clusters (default: 6)
  -m METRIC, --metric METRIC
                        metric for k-means,euclidean, dtw,softdtw (default:
                        euclidean)
  --log2                log2 transform raw values (default: False)
  --index               index is false (default: False)
  --header              header is false (default: False)
  -o OUTPUT_LABEL, --output_label OUTPUT_LABEL
                        output prefix (default: ts_kmeans_yli11_2021-03-23)
  --transpose           df transpose (default: False)
  --scale_t0            scale data to t0 (default: False)
Summary
Performing K-means cluster given an input table.
Input
1. data table with each column representing a time point and each row representing a sample (e.g., a gene)
Input data can be both csv or tsv. Please use -s , for csv and -s "\t" for tsv. Please also use --index --header to tell the program that the input table has index and header.
Example input: /home/yli11/test/ts_test/input.csv
2. time point list (the order matters)
This is used for specifying replicates in each time plot, for example:
(py2) [yli11@nodecn202 ts_test]$ head time.list
0hr     0hr_1
0hr     0hr_2
3hr     3hr_1
3hr     3hr_2
7hr     7hr_1
7hr     7hr_2
14hr    14hr_1
The first column is the time point, the second column is the column name used in the table above.
Example input: /home/yli11/test/ts_test/time.list
Usage
module load conda3

source activate /home/yli11/.conda/envs/py2/

ts_kmeans.py -f input.csv -t time.list --index --header -s , --log2 -n 6 --scale_t0 -o my_output_label
Output
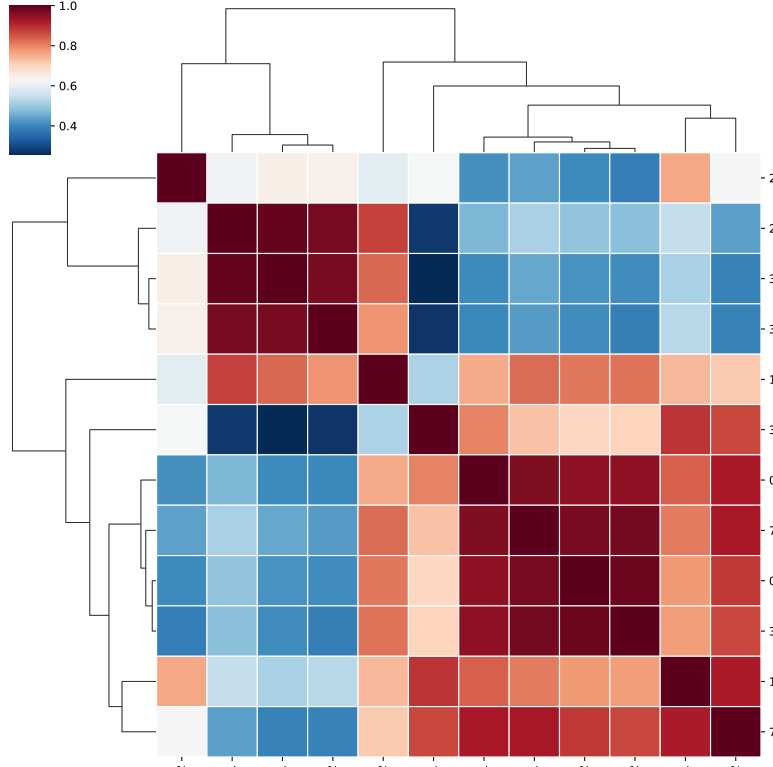
1. For QC purpose, look at sample correlation
The output figure is output_label.corr.pdf
2. Raw data with cluster assignment
The output table is output_label.clusters.csv
The last column is the cluster assignment, starting from 0.
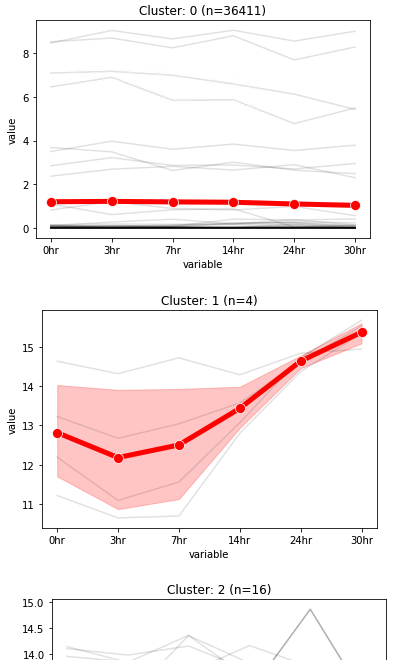
3. Visualization of data trend in each cluster
The output table is output_label.clusters.N.pdf
Notes
I haven’t had a very good result using this ts-kmeans algorithm as well as more advanced DTW algorithms. The best results, more interpretable ones I had were using hierarchical clustering. A review on time-seirs clustering showed the best algorithm is usually data dependent. But from the evaluation tables, I found heirarchnical clustering performance is quite good.
Ref: https://www.sciencedirect.com/science/article/pii/S2666827020300013#sec4.3
Comments
code @ github.