Manhanttan plot in circos
Summary
Manhanttan plot is a way to visualize 1D values when you need to preserve the order (e.g., genomic positions). People also add colors (e.g., different chromosomes) or sizes to the plot, which makes it suitable for 2D or 3D datasets. However, when you have 100+ regions/loci and you want to visualize them in the same figure, linear manhanttan plot can’t do that. In such case, you need circos.
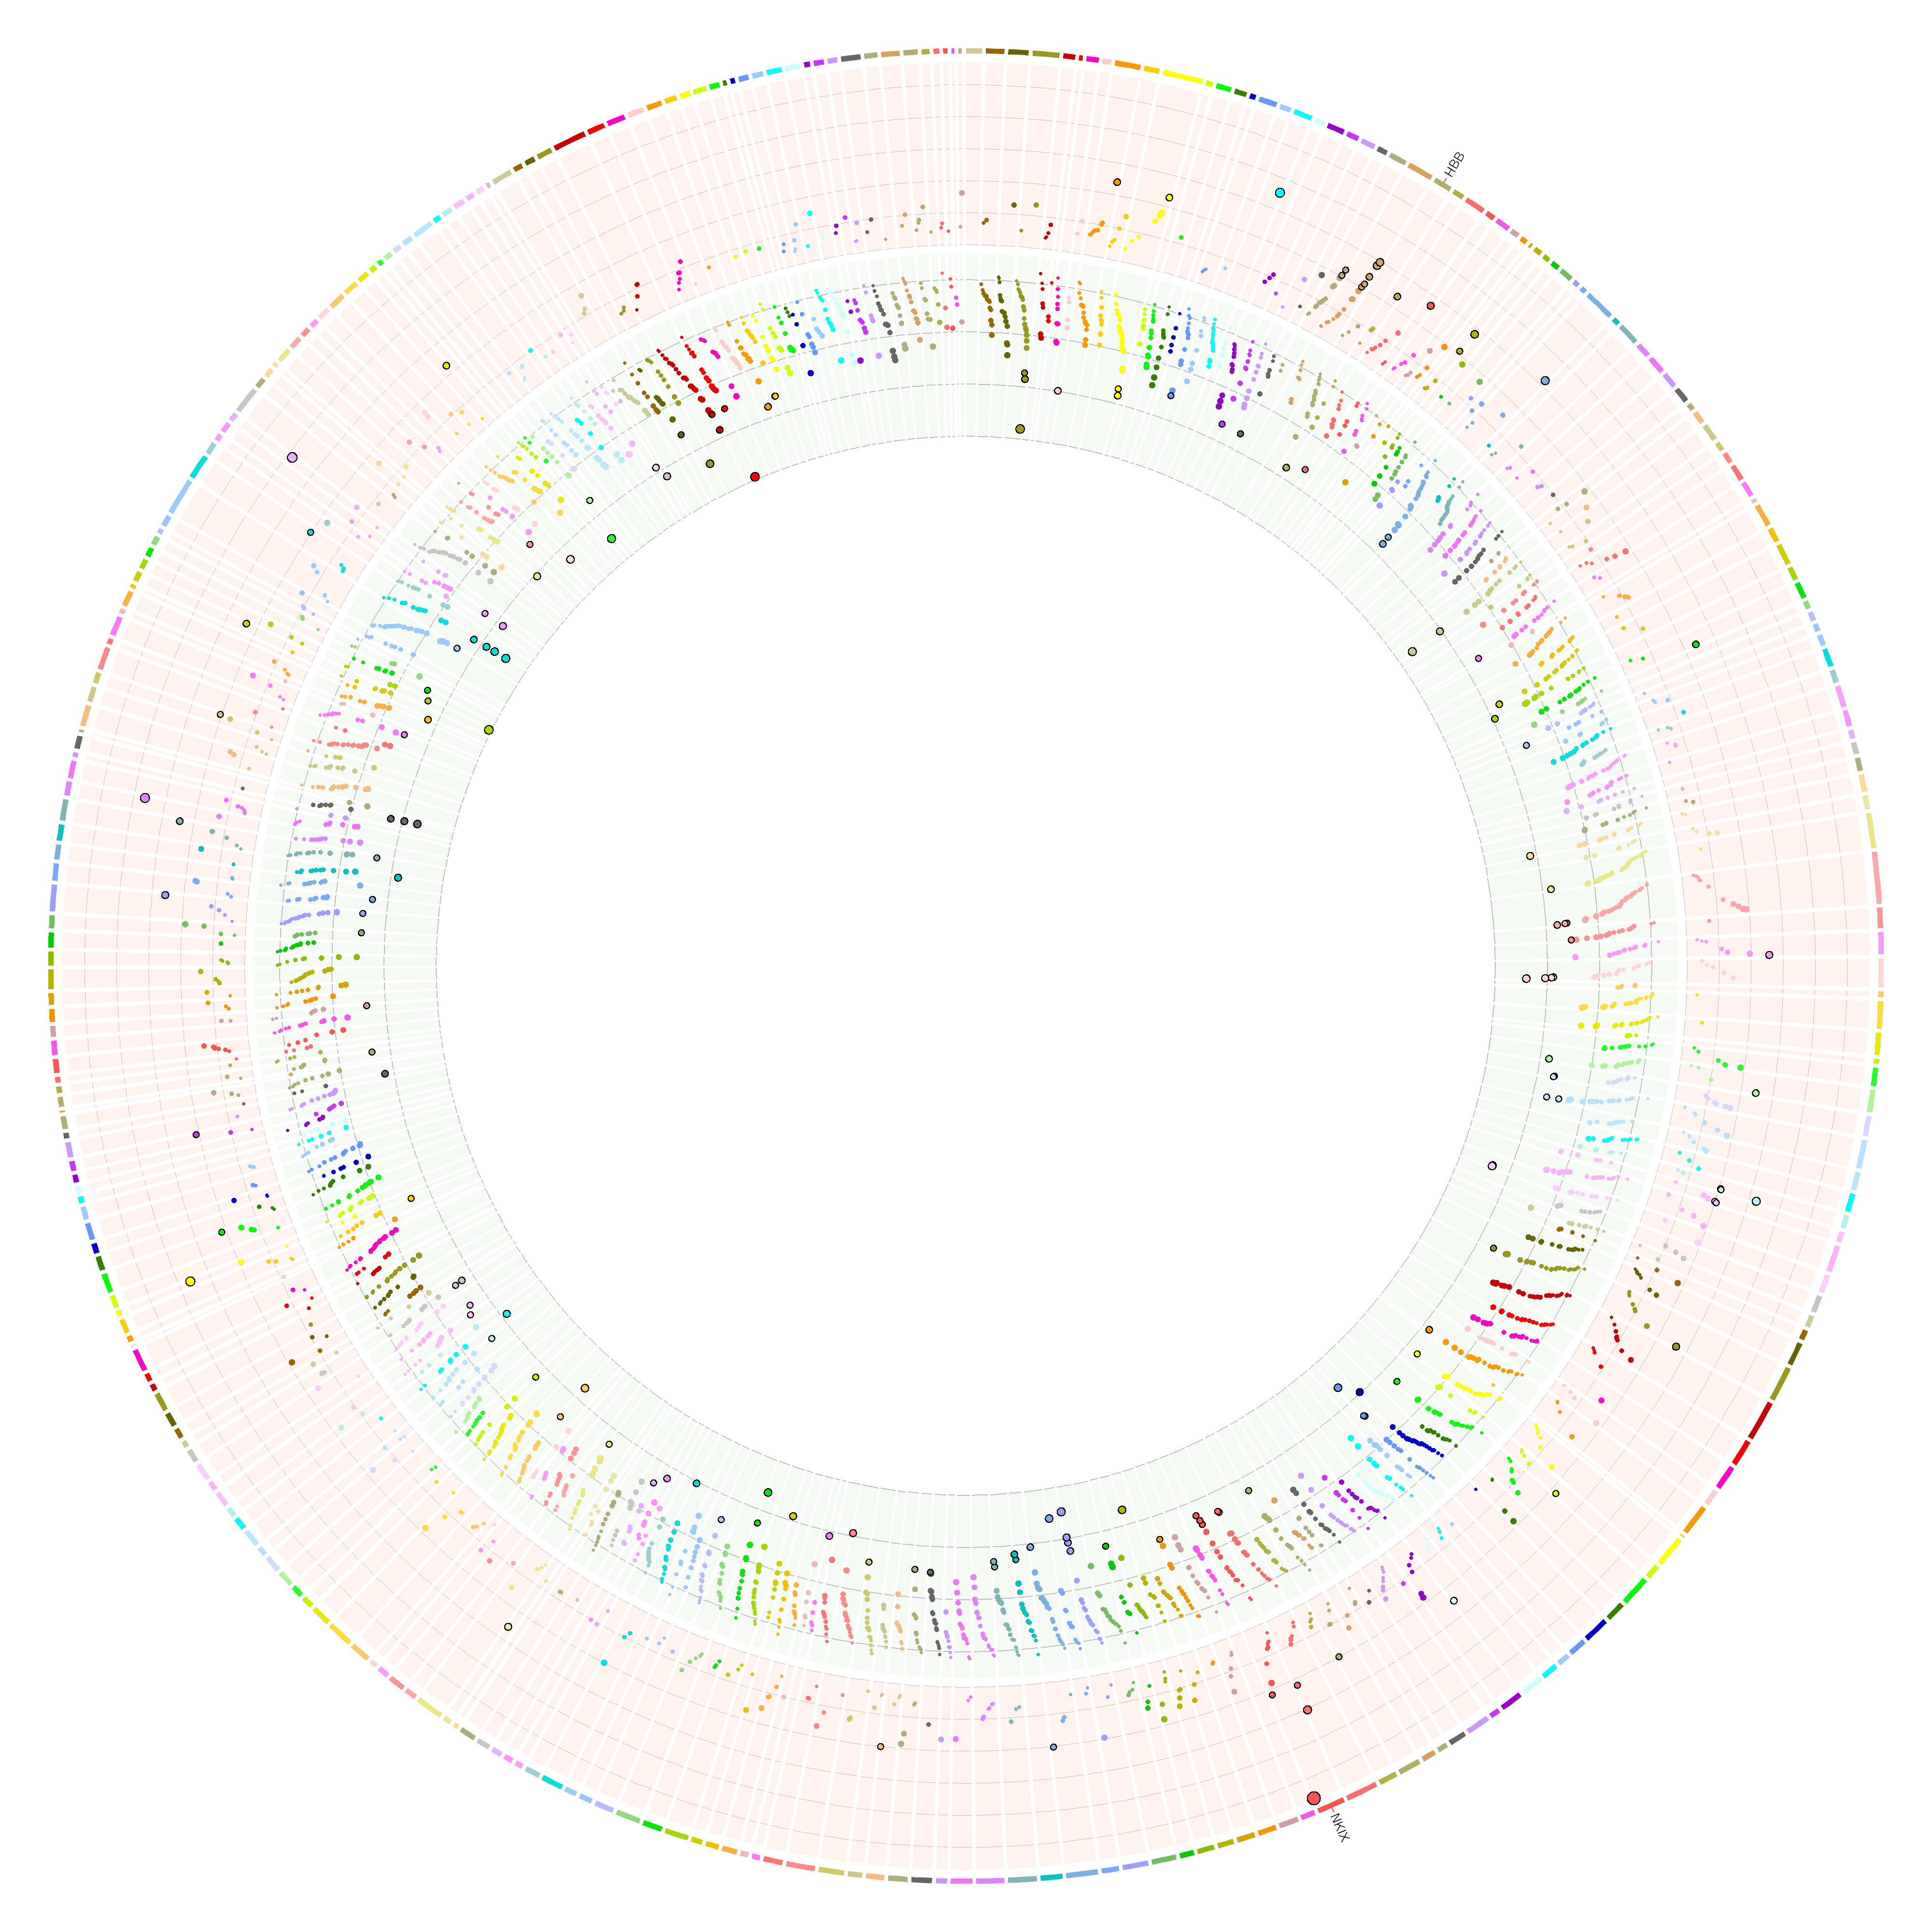
This image shows the base editor results (HbF high vs low) for 306 loci, each with ~20 gRNA. Red means positive log fold change; green means negative LFC.
Note
Please note that the following program assumes: (1) there are positive and negative values in your input values, and positive values are shown with red BG color and negative values are shown with green BG color. (2) The input coordinates are sorted (the plot uses the same order presented in your input file starting from 12 o’clock) and this circos plot only display the input regions, not any other genomic regions.
Tip
If you only have positive or negative values, you can still use this program. Just that, when you see the figure, there will be no points in either red tracks or green tracks. You can then turn off those tracks by removing the corresponding <plot> in circos.conf, and do circos -conf circos.conf -noparanoid -param image/radius=2000p again.
Tip
If you want to display your regions in the chromosomal order (e.g., chr1, chr2,…, chrX, chrY), then the input file should be sorted that way!
Usage
Make sure you have installed HemTools standalone tools.
See [installation](https://hemtools.readthedocs.io/en/latest/content/Installation/Installation.html#installation-for-stand-alone-tools)
Step 1
hpcf_interactive -q standard -R "rusage[mem=4000]"
Step 2
module purge

module load python/2.7.12 circos
Step 3
To see the help message:
circos_Manhattan -h
To run an example:
circos_Manhattan -f /home/yli11/HemTools/share/circos_Manhanttan/LFC.bed.sorted --genes /home/yli11/HemTools/share/circos_Manhanttan/gene.bed
To run your own data:
For that, you need two input files; they are all tsv files.
numerical values tsv (-f)
gene definition tsv (–genes)
circos_Manhattan -f your_numerical_values.tsv --genes your_genes.bed