DESEQ2 for differential peak analysis
usage: DiffPeak [-h] [-b BAMS] [-d DESIGN_MATRIX] [-p PEAKS] [-x DRY_RUN]
                [-g GENOME] [-z SUBMIT_JOB] [-r FLAG]
                [--include_unmapped_reads] [-s] [-mm] [-j JID]

optional arguments:
  -h, --help            show this help message and exit
  -b BAMS, --bams BAMS  list of bam files (include path to file)
  -d DESIGN_MATRIX, --design_matrix DESIGN_MATRIX
                        Each line is a group. Every group will be compared
                        against the 'control' group. So you have to specify a
                        control group in your input. The format for each line
                        is: group_id:file_name_1,file_name_2. Just need file
                        name, no need for the path to file.
  -p PEAKS, --peaks PEAKS
                        list of narrowPeak files (include path to file), need
                        the last line to be empty (i.e. so as to have the
                        newline character).
  -x DRY_RUN, --dry_run DRY_RUN
                        1 or 0. 1: dry run, to check system commands
  -g GENOME, --genome GENOME
                        genome version
  -z SUBMIT_JOB, --submit_job SUBMIT_JOB
                        1 or 0. 1: submit this job to HPC
  -r FLAG, --flag FLAG  1 or 0. 1: run this job in terminal. 0: submit this
                        job.
  --include_unmapped_reads
                        Expecting global change, need normalization by total
                        reads
  -s, --single          run featureCount in single-end mode
  -mm, --mm_reads       including multi-mapped reads, this is for HBG promoter
                        reads
  -j JID, --jid JID     enter a job ID, which is used to make a new directory.
                        Every output will be moved into this folder.
Summary
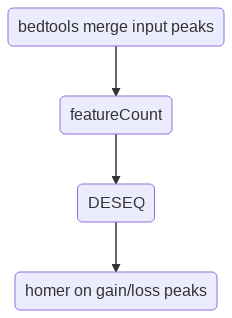
This program performs differential peak analysis by taking the union of input peaks (i.e., bedtools merge), counting number of reads (for pair-end, it is number of fragments), then running DESEQ2. At the last step, peaks will be divided into gain or loss, each of which will be used to perform motif discovery using homer. The files *loss.bed and *gain.bed are not full list of differential peaks, these are just top 100 peaks used for motif discovery. Users can open *diffRegions.txt to extract their own diff peaks based on q-value and logFC.
Note
By default, DESEQ2 normalization is performed on total reads in peaks. You can also do it on raw total reads (i.e., sequencing depth), by using --include_unmapped_reads.
2/10/2025 added Batch correction
To perform batch correction, the program is diffPeak_BC.py, every other things keep the same. The batch is assumed to match the sample order in your input design_matrix. For example, control batch 1 and batch 2 is A and B, Mutant batch 1 and batch 2 is C and D. Then the input design matrix should be
control:path_to/A,path_to/B
Mutant:path_to/C,path_to/D
Flowchart
Usage
hpcf_interactive

module load python/2.7.12

dos2unix bams.list
dos2unix design_matrix
dos2unix peaks.list

diffPeak.py -b bams.list -d design_matrix -p peaks.list -z 1 -g hg38 -mm
``-z 1 `` tells the program to submit this job to HPC. Otherwise, diffPeak will just run interactively.
If you want to include all reads for DESEQ normalization, please add --include_unmapped_reads option. Note that this option tends to give a little less significant p-value and logFC.
If you are using single-end bam, please add -s option.
Input
Sample input examples are shown here: https://benchling.com/s/etr-FHkOZSXjFTUTDROQ2xu2
[yli11@noderome333 DiffPeaks]$ head bam.list
2659981_20copy_atac_1_S13_L007.rmdup.uq.rmchrM.bam
2659982_20copy_atac_2_S14_L007.rmdup.uq.rmchrM.bam
2659983_hgcOPT_s4_atac_1_S15_L007.rmdup.uq.rmchrM.bam
2659984_hgcOPT_s4_atac_2_S16_L007.rmdup.uq.rmchrM.bam
2659985_hgcOPT_s5_atac_1_S17_L007.rmdup.uq.rmchrM.bam
2659986_hgcOPT_s5_atac_2_S18_L007.rmdup.uq.rmchrM.bam
2659987_hgcOPT_s22_atac_1_S19_L007.rmdup.uq.rmchrM.bam
2659988_hgcOPT_s22_atac_2_S20_L007.rmdup.uq.rmchrM.bam
2659989_dCTCF_s3_atac_1_S21_L007.rmdup.uq.rmchrM.bam
2659990_dCTCF_s3_atac_2_S22_L007.rmdup.uq.rmchrM.bam
[yli11@noderome333 DiffPeaks]$ head design.tsv
control:2659995_Jurkat_atac_1_S59_L008.rmdup.uq.rmchrM.bam,2659996_Jurkat_atac_2_S60_L008.rmdup.uq.rmchrM.bam
20copy:2659981_20copy_atac_1_S13_L007.rmdup.uq.rmchrM.bam,2659982_20copy_atac_2_S14_L007.rmdup.uq.rmchrM.bam
hgcOPT_s4:2659983_hgcOPT_s4_atac_1_S15_L007.rmdup.uq.rmchrM.bam,2659984_hgcOPT_s4_atac_2_S16_L007.rmdup.uq.rmchrM.bam
hgcOPT_s5:2659985_hgcOPT_s5_atac_1_S17_L007.rmdup.uq.rmchrM.bam,2659986_hgcOPT_s5_atac_2_S18_L007.rmdup.uq.rmchrM.bam
hgcOPT_s22:2659987_hgcOPT_s22_atac_1_S19_L007.rmdup.uq.rmchrM.bam,2659988_hgcOPT_s22_atac_2_S20_L007.rmdup.uq.rmchrM.bam
dCTCF_s3:2659989_dCTCF_s3_atac_1_S21_L007.rmdup.uq.rmchrM.bam,2659990_dCTCF_s3_atac_2_S22_L007.rmdup.uq.rmchrM.bam
dCTCF_s4:2659991_dCTCF_s4_atac_1_S55_L008.rmdup.uq.rmchrM.bam,2659992_dCTCF_s4_atac_2_S56_L008.rmdup.uq.rmchrM.bam
dCTCF_s13:2659993_dCTCF_s13_atac_1_S57_L008.rmdup.uq.rmchrM.bam,2659994_dCTCF_s13_atac_2_S58_L008.rmdup.uq.rmchrM.bam
[yli11@noderome333 DiffPeaks]$ head peak.list
union_peak.bed
Input file syntax:
File names are separated by comma. No space bettwen them.
For design matrix, the first line
controlis a keyword. All the remaining lines will be compared to thecontrolline.Leave the last line blank.
How to get union_peak.bed
Go to your hemtools job folder peak_files, e.g., atac_seq_yli11_2024-02-06/peak_files,
module load python3 bedtools

merge_peak_on_summit.py -o union_peak.bed -e rmdup.uq.rmchrM_summits.bed

bedtools intersect -a union_peak.bed -b hg38.blacklist.bed -v > union_peak.rmblck.bed
Output
Gain and Loss is relative speaking to control. So gain means the region has more reads in treatment and less reads in control group, so is logFC > 0.
Read count table is generated in DEseq2_results folder
DESEQ2 result (
control-[user_input_group].diffRegions.txt) is generated in homer_motifs folder. In this file,logFC < 0 means gain, the peak has less read count in control group.. In all other files (e.g., values in bdg_files folder) are corrected.
Apply LFC shrinkage
Users can use the generated count table count_table.bed and run the DESEQ2 analysis themself. An example to apply LFC shrinkage is here: DEseq2_example
FAQ
No significant differential peaks, too many adj pvalues = 1
P-value calculated is based on mean and variance. If there are no significant results, it means that the estimated dispersion (i.e., variance) is large enough to decrease the significance. This could be due to many reasons. You can try the following (ranked by likelihood):
Low number of replicates.
How we normalize the reads: try with or without this option.
--include_unmapped_readstry to identify outliers
try different number of peaks. (MACS2, by varying its p-value threshold, you can get different number of peaks)
data quality
It is a fact that there is truly no difference.
Notes
When the logFC is similar (e.g., logFC=1), EdgeR quasi-likelihood test tend to have more significant p-value.
Ref
https://support.bioconductor.org/p/95949/
https://www.biostars.org/p/251411/