Load library
[1]:
library("DESeq2")
Loading required package: S4Vectors

Loading required package: stats4

Loading required package: BiocGenerics

Loading required package: parallel


Attaching package: ‘BiocGenerics’


The following objects are masked from ‘package:parallel’:

    clusterApply, clusterApplyLB, clusterCall, clusterEvalQ,
    clusterExport, clusterMap, parApply, parCapply, parLapply,
    parLapplyLB, parRapply, parSapply, parSapplyLB


The following objects are masked from ‘package:stats’:

    IQR, mad, sd, var, xtabs


The following objects are masked from ‘package:base’:

    anyDuplicated, append, as.data.frame, basename, cbind, colnames,
    dirname, do.call, duplicated, eval, evalq, Filter, Find, get, grep,
    grepl, intersect, is.unsorted, lapply, Map, mapply, match, mget,
    order, paste, pmax, pmax.int, pmin, pmin.int, Position, rank,
    rbind, Reduce, rownames, sapply, setdiff, sort, table, tapply,
    union, unique, unsplit, which.max, which.min


Attaching package: ‘S4Vectors’


The following object is masked from ‘package:base’:

    expand.grid


Loading required package: IRanges

Loading required package: GenomicRanges

Loading required package: GenomeInfoDb

Loading required package: SummarizedExperiment

Loading required package: MatrixGenerics

Loading required package: matrixStats


Attaching package: ‘MatrixGenerics’


The following objects are masked from ‘package:matrixStats’:

    colAlls, colAnyNAs, colAnys, colAvgsPerRowSet, colCollapse,
    colCounts, colCummaxs, colCummins, colCumprods, colCumsums,
    colDiffs, colIQRDiffs, colIQRs, colLogSumExps, colMadDiffs,
    colMads, colMaxs, colMeans2, colMedians, colMins, colOrderStats,
    colProds, colQuantiles, colRanges, colRanks, colSdDiffs, colSds,
    colSums2, colTabulates, colVarDiffs, colVars, colWeightedMads,
    colWeightedMeans, colWeightedMedians, colWeightedSds,
    colWeightedVars, rowAlls, rowAnyNAs, rowAnys, rowAvgsPerColSet,
    rowCollapse, rowCounts, rowCummaxs, rowCummins, rowCumprods,
    rowCumsums, rowDiffs, rowIQRDiffs, rowIQRs, rowLogSumExps,
    rowMadDiffs, rowMads, rowMaxs, rowMeans2, rowMedians, rowMins,
    rowOrderStats, rowProds, rowQuantiles, rowRanges, rowRanks,
    rowSdDiffs, rowSds, rowSums2, rowTabulates, rowVarDiffs, rowVars,
    rowWeightedMads, rowWeightedMeans, rowWeightedMedians,
    rowWeightedSds, rowWeightedVars


Loading required package: Biobase

Welcome to Bioconductor

    Vignettes contain introductory material; view with
    'browseVignettes()'. To cite Bioconductor, see
    'citation("Biobase")', and for packages 'citation("pkgname")'.


Attaching package: ‘Biobase’


The following object is masked from ‘package:MatrixGenerics’:

    rowMedians


The following objects are masked from ‘package:matrixStats’:

    anyMissing, rowMedians
Read count table
This count table is generated from the diffpeak pipeline: https://hemtools.readthedocs.io/en/latest/content/Differential_analysis/deseq2_diffpeak.html?highlight=diffpeak
[2]:
infile="DiffPeak_syi_2021-11-16.count_table.bed"
countData = read.csv(infile,sep="\t")
head(countData)
| Geneid | Chr | Start | End | Strand | Length | X1098561_Hudep2_CTCF.rmdup.uq.bam | X1047954_Hudep2_CTCF_50bp.rmdup.uq.bam | X2268629_KO_29_CTCF_S134_L004.rmdup.uq.bam | X2268630_KO_68_CTCF_S135_L004.rmdup.uq.bam | |
|---|---|---|---|---|---|---|---|---|---|---|
| <chr> | <chr> | <int> | <int> | <chr> | <int> | <int> | <int> | <int> | <int> | |
| 1 | region_1 | chr1 | 15918 | 16556 | + | 639 | 52 | 34 | 278 | 32 |
| 2 | region_2 | chr1 | 54581 | 54686 | + | 106 | 6 | 9 | 38 | 3 |
| 3 | region_3 | chr1 | 91023 | 91696 | + | 674 | 38 | 15 | 381 | 130 |
| 4 | region_4 | chr1 | 104705 | 105259 | + | 555 | 40 | 34 | 150 | 34 |
| 5 | region_5 | chr1 | 115570 | 115837 | + | 268 | 35 | 19 | 140 | 23 |
| 6 | region_6 | chr1 | 138518 | 139511 | + | 994 | 32 | 20 | 268 | 24 |
Specify design matrix, control + treatment
[3]:
group1=c("X1098561_Hudep2_CTCF.rmdup.uq.bam","X1047954_Hudep2_CTCF_50bp.rmdup.uq.bam") # WT
group2=c("X2268629_KO_29_CTCF_S134_L004.rmdup.uq.bam","X2268630_KO_68_CTCF_S135_L004.rmdup.uq.bam") # KO
group_label <- c(rep("control", length(group1)), rep("treatment", length(group2)))
[4]:
group_label
- 'control'
- 'control'
- 'treatment'
- 'treatment'
Get count matrix
[5]:
mat <- countData[,7:10]
rownames(mat) <- countData[,1]
head(mat)
| X1098561_Hudep2_CTCF.rmdup.uq.bam | X1047954_Hudep2_CTCF_50bp.rmdup.uq.bam | X2268629_KO_29_CTCF_S134_L004.rmdup.uq.bam | X2268630_KO_68_CTCF_S135_L004.rmdup.uq.bam | |
|---|---|---|---|---|
| <int> | <int> | <int> | <int> | |
| region_1 | 52 | 34 | 278 | 32 |
| region_2 | 6 | 9 | 38 | 3 |
| region_3 | 38 | 15 | 381 | 130 |
| region_4 | 40 | 34 | 150 | 34 |
| region_5 | 35 | 19 | 140 | 23 |
| region_6 | 32 | 20 | 268 | 24 |
RUN DEseq2
[6]:
sample_info <- data.frame(sampleName=c(group1, group2), Group=group_label)
dds <- DESeqDataSetFromMatrix(countData=mat, colData=sample_info, design=~Group)
dds = DESeq(dds) # main function
res=results(dds)
raw_count = counts(dds)
norm_count = counts(dds,normalized=TRUE)
Warning message in DESeqDataSet(se, design = design, ignoreRank):
“some variables in design formula are characters, converting to factors”
estimating size factors

estimating dispersions

gene-wise dispersion estimates

mean-dispersion relationship

final dispersion estimates

fitting model and testing
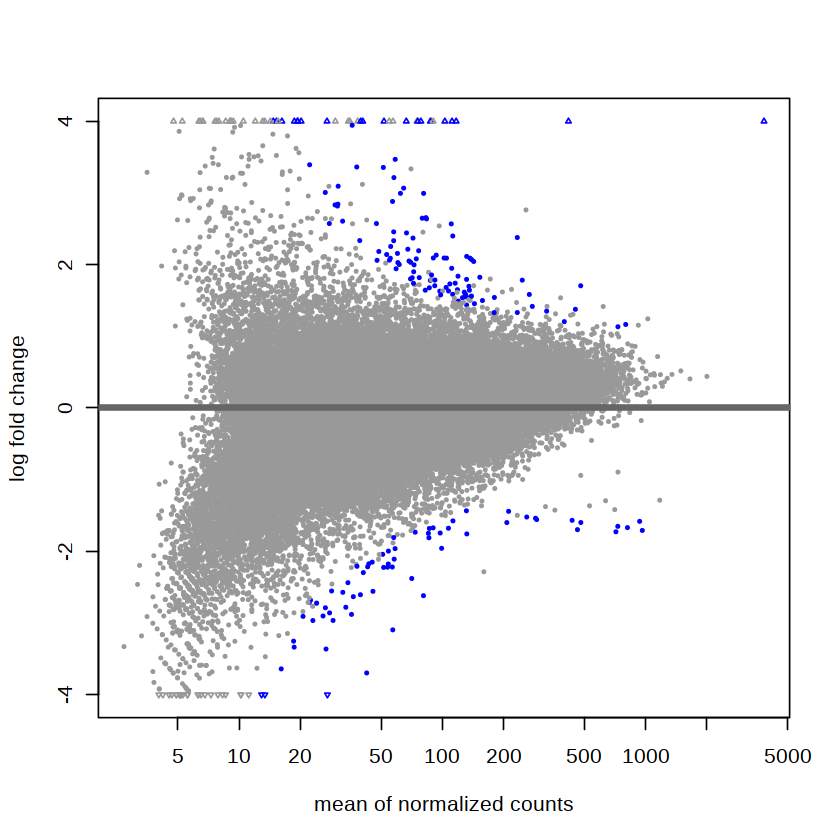
Save result (this is the result without LFC shrinkage)
[7]:
outfile="deseq2.result"
colnames(norm_count) = paste(colnames(norm_count),".norm",sep="")
d <- data.frame(countData,norm_count, logFC=res[,"log2FoldChange"], AveExpr=res[,"baseMean"], t=res[,"stat"], P.Value=res[,"pvalue"], adj.P.Val=res[,"padj"])
d <- d[order(d[,"P.Value"]),]
write.table(d, file=paste(outfile, ".deseq2_wo_lfcShrink.tsv", sep=""), sep="\t", quote=FALSE, row.names=FALSE)
[8]:
plotMA(res, ylim = c(-4, 4))
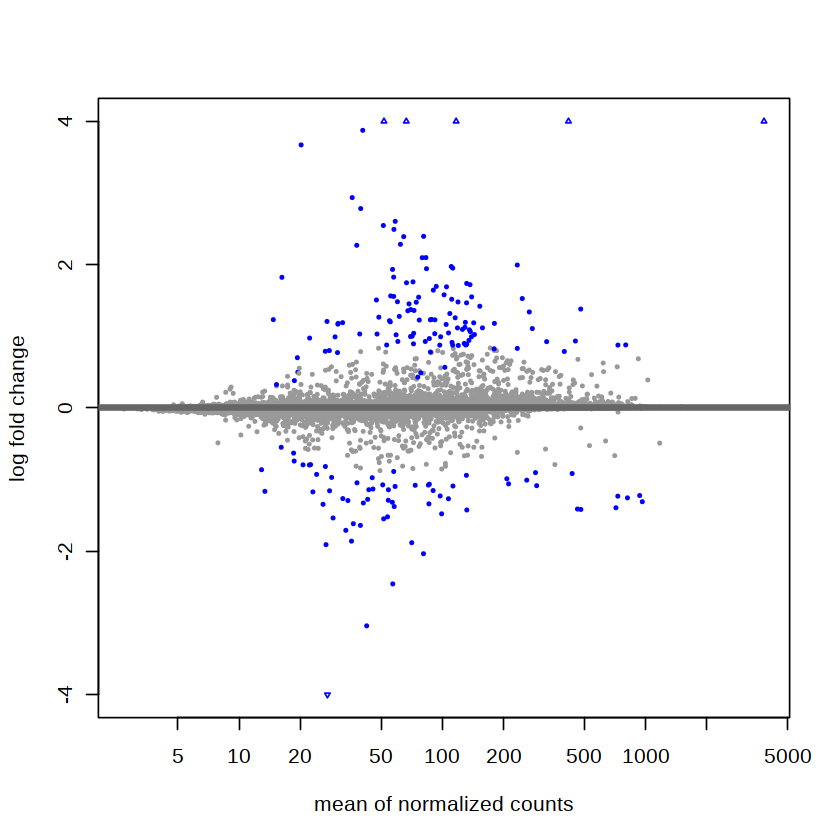
apply LFC shrinkage
[10]:
res <- lfcShrink(dds,coef="Group_treatment_vs_control", type="ashr")
plotMA(res, ylim = c(-4, 4))
using 'ashr' for LFC shrinkage. If used in published research, please cite:
    Stephens, M. (2016) False discovery rates: a new deal. Biostatistics, 18:2.
    https://doi.org/10.1093/biostatistics/kxw041
save new result
[12]:
head(res)
log2 fold change (MMSE): Group treatment vs control
Wald test p-value: Group treatment vs control
DataFrame with 6 rows and 5 columns
          baseMean log2FoldChange     lfcSE      pvalue       padj
         <numeric>      <numeric> <numeric>   <numeric>  <numeric>
region_1  63.44804     0.00805928 0.0788364 3.31818e-01 0.99770039
region_2   9.55499    -0.00183120 0.1008589 8.50857e-01         NA
region_3 110.64886     1.97421221 0.5220874 6.11724e-07 0.00147051
region_4  52.58138     0.00282279 0.0643666 6.94088e-01 0.99770039
region_5  38.47367     0.00579136 0.0769100 4.82171e-01 0.99770039
region_6  47.76244     0.03886980 0.1892013 6.02855e-02 0.90094156
[13]:
outfile="deseq2.result"
colnames(norm_count) = paste(colnames(norm_count),".norm",sep="")
d <- data.frame(countData,norm_count, logFC=res[,"log2FoldChange"], AveExpr=res[,"baseMean"], P.Value=res[,"pvalue"], adj.P.Val=res[,"padj"])
d <- d[order(d[,"P.Value"]),]
write.table(d, file=paste(outfile, ".deseq2_with_lfcShrink.tsv", sep=""), sep="\t", quote=FALSE, row.names=FALSE)