ggpubr violin plot for comparing number of fragments
one step code
go to your data dir
module load python/2.7.12
prepare sample.list
sample.list (tab-seperated) will have the format showing below:
test1.bed |
1631310_RFA005.bam |
test1 |
|---|---|---|
test2.bed |
1631310_RFA005.bam |
test2 |
cp /research/dept/hem/common/sequencing/chenggrp/pipelines/misc/data_vis/Li_violin_plot/ggpubR_violin.py .
python ggpubR_violin.py
When job finished, the violin plot will be sent to you
you can then adjust the figure yourself, the program will generate a data file called for_ggpubr.csv
[1]:
df = read.csv("for_ggpubr.csv",header=F)
df[sample(dim(df)[1],5),]
| V1 | V2 | |
|---|---|---|
| 161 | 17 | test1.out |
| 446 | 9 | test2.out |
| 47 | 14 | test1.out |
| 435 | 2 | test2.out |
| 316 | 6 | test1.out |
[4]:
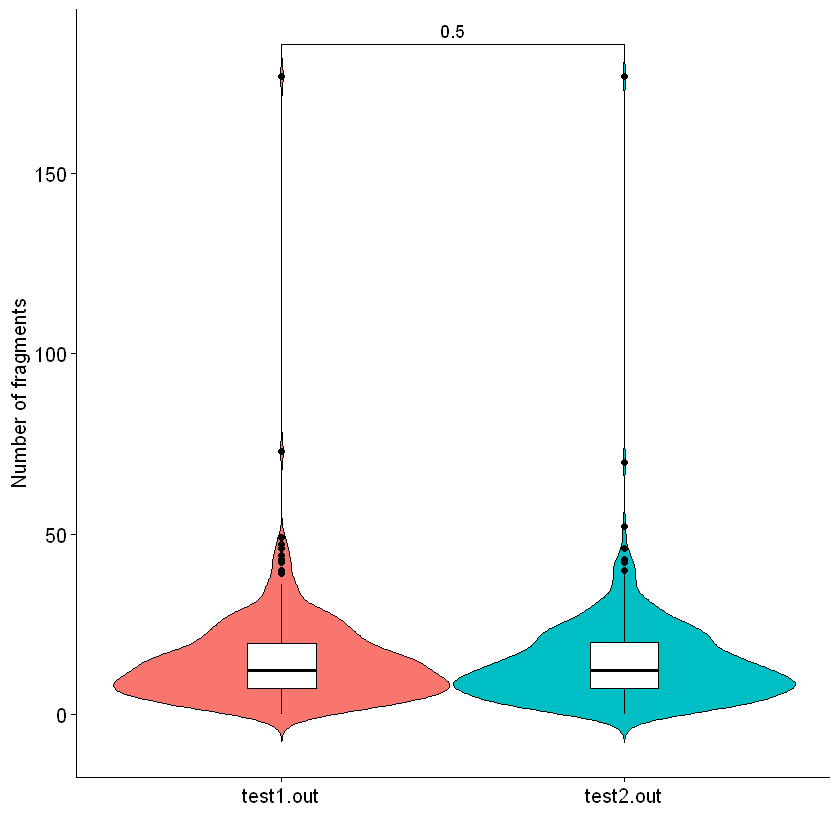
library(ggpubr)
comp = list(c('test1.out',"test2.out"))
a=ggviolin(df,x="V2",y="V1",color="black",fill="V2",add = "boxplot", add.params = list(fill = "white"))
a=a+stat_compare_means(comparisons = comp)+
xlab("")+
ylab("Number of fragments")+
guides(fill=FALSE)
print (a)
ggsave("violin_bed_reads.png",dpi=200,width=3,height=5)