ggplot Scatter plot gRNA counts version 2
read data
[2]:
file="ABE.count_normalized_high_vs_low_with_color"
df = read.csv(paste(file,".txt",sep=""),sep="\t")
df$HBF_high = log2(df$HBF_high)
df$HBF_low = log2(df$HBF_low)
[3]:
head(df)
| sgRNA | HBF_high | HBF_low | color |
|---|---|---|---|
| Positive:TGTGCTTGGTCGGCACTGAT | 5.720407 | 6.285899 | red |
| Positive:TGGCATCCAGGTCACGCCAG | 6.938099 | 7.177026 | red |
| Positive:TGCTTGGTCGGCACTGATAG | 7.064446 | 6.670656 | red |
| Positive:TGCCAGATGAACTTCCCATT | 7.698943 | 7.731442 | red |
| Positive:TCTGATTAGGGTGGGGGCGT | 7.374890 | 6.215650 | red |
| Positive:TCCCCTTCTGGAGCTCCCAA | 6.362533 | 6.551940 | red |
scatter plot
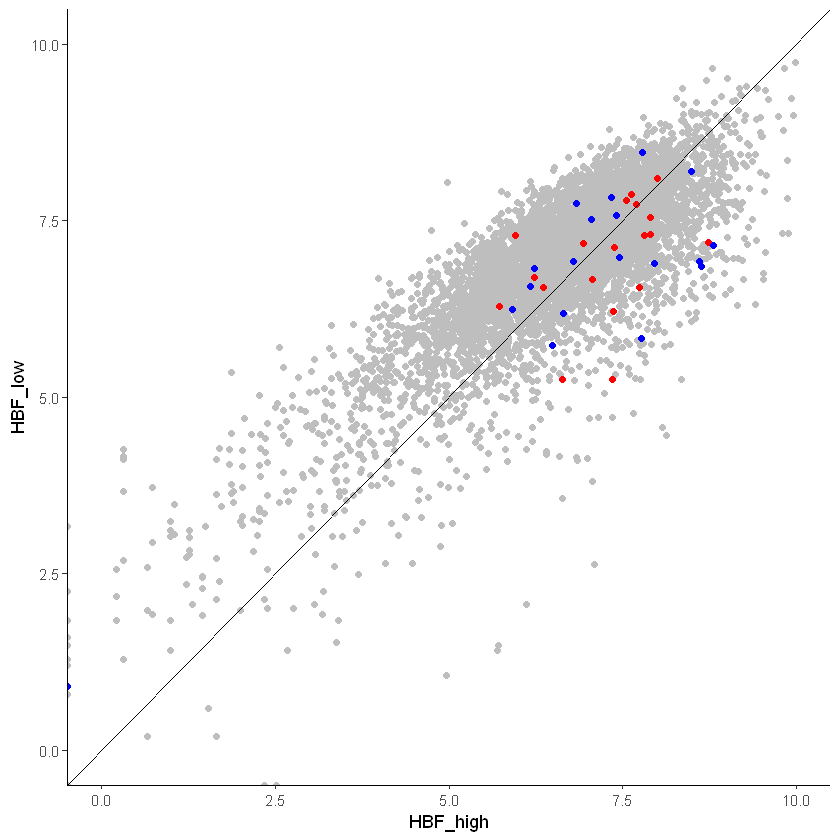
[7]:
library(ggplot2)
ggplot(df, aes(x = HBF_high, y = HBF_low)) +
geom_point(data = subset(df, color %in% c("grey")),color="grey")+
geom_point(data = subset(df, color %in% c("red")),color="red")+
geom_point(data = subset(df, color %in% c("blue")),color="blue")+
geom_abline(intercept = 0, slope = 1, color="black",  size=0.5)+
xlim(0, 10)+
ylim(0, 10)+
theme_classic()
ggsave(paste(file,".png",sep=""),dpi=300)
Warning message:
"Removed 25 rows containing missing values (geom_point)."Warning message:
"Removed 1 rows containing missing values (geom_point)."Saving 6.67 x 6.67 in image
Warning message:
"Removed 25 rows containing missing values (geom_point)."Warning message:
"Removed 1 rows containing missing values (geom_point)."