DeepTools tutorial
Common NGS data formats and tools
Objectives
You should be familiar with the following common examples that we use daily:
Sequence retrieval
Read alignment
SAM/BAM query: index, sort, stats, visualization, filter, subset
SAM format, SAM flags
BED: sort, intersect (remove), merge
bw: plot aggregated signal, sample correlation
Data formats
fasta
fastq
bam / bam.bai / sam
bed / bed4 / bed6 / bed6+4 == narrowPeak / bed12
wiggle / bedgraph / bigwiggle
vcf
gtf / gff / gff3
tsv / csv
.py / .R / .sh / .jar / .pl
Please refer to the UCSC format FAQ for “official” definition
Tools
fastqc / fastp
seqtk
BWA / bowtie2 / STAR
samtools
bedtools
deeptools
scripting languange: Python
wiggle, bigwiggle or bedgraph format
These file formats store signal values for each base, or a fixed/variable region.
The simplest format will be bedgraph file, this is a 4-column tsv file and the columns are: chr, start, end, value
bigwiggle is just a binary format (compressed file) for bedgraph or wiggle.
Wiggle format is little big complicated,see https://genome.ucsc.edu/goldenPath/help/wiggle.html.
These 3 formats are inter-convertable.
Get Started
[3]:
!deeptools --version
deeptools 3.5.1
Sample Correlation based on bam
The index file (.bai) for each bam file is required!
Step 1. Create count matrix
[6]:
!/usr/bin/time -v multiBamSummary bins -b bam_data/*bam -o result.npz -bs 50000 -r chr21 -p 2
Number of bins found: 962
        Command being timed: "multiBamSummary bins -b bam_data/SRR2920466_hematopoietic_stem_cell.chr21.bam bam_data/SRR2920467_multipotent_progenitor_cell.chr21.bam bam_data/SRR2920468_lymphoid-primed_multipotent_progenitor_cell.chr21.bam bam_data/SRR2920469_common_myeloid_progenitor_cell.chr21.bam bam_data/SRR2920470_common_myeloid_progenitor_cell.chr21.bam bam_data/SRR2920471_granulocyte_macrophage_progenitor_cell.chr21.bam bam_data/SRR2920472_granulocyte_macrophage_progenitor_cell.chr21.bam bam_data/SRR2920473_megakaryocyte_erythroid_progenitor_cell.chr21.bam bam_data/SRR2920474_megakaryocyte_erythroid_progenitor_cell.chr21.bam bam_data/SRR2920475_CD14+_monocyte_cell.chr21.bam bam_data/SRR2920476_CD14+_monocyte_cell.chr21.bam bam_data/SRR2920477_hematopoietic_stem_cell.chr21.bam bam_data/SRR2920478_hematopoietic_stem_cell.chr21.bam bam_data/SRR2920479_multipotent_progenitor_cell.chr21.bam bam_data/SRR2920480_lymphoid-primed_multipotent_progenitor_cell.chr21.bam bam_data/SRR2920481_common_myeloid_progenitor_cell.chr21.bam bam_data/SRR2920482_common_myeloid_progenitor_cell.chr21.bam bam_data/SRR2920483_granulocyte_macrophage_progenitor_cell.chr21.bam bam_data/SRR2920484_granulocyte_macrophage_progenitor_cell.chr21.bam bam_data/SRR2920485_megakaryocyte_erythroid_progenitor_cell.chr21.bam bam_data/SRR2920486_megakaryocyte_erythroid_progenitor_cell.chr21.bam bam_data/SRR2920487_CD14+_monocyte_cell.chr21.bam bam_data/SRR2920488_CD14+_monocyte_cell.chr21.bam bam_data/SRR2920489_CD34+_bone_marrow.chr21.bam bam_data/SRR2920490_CD34+_bone_marrow.chr21.bam bam_data/SRR2920491_CD34+_cord_blood.chr21.bam bam_data/SRR2920492_CD19+CD20+_B_cell.chr21.bam bam_data/SRR2920493_CD4+_T_cell.chr21.bam bam_data/SRR2920494_CD8+_T_cell.chr21.bam bam_data/SRR2920495_CD56+_natural_killer_cell.chr21.bam bam_data/SRR2920496_CD4+_T_cell.chr21.bam bam_data/SRR2920497_CD8+_T_cell.chr21.bam bam_data/SRR2920498_common_lymphoid_progenitor_cell.chr21.bam bam_data/SRR2920499_common_lymphoid_progenitor_cell.chr21.bam bam_data/SRR2920500_common_myeloid_progenitor_cell.chr21.bam bam_data/SRR2920501_common_myeloid_progenitor_cell.chr21.bam bam_data/SRR2920502_CD71+GPA+_erythroblast_cell.chr21.bam bam_data/SRR2920503_CD71+GPA+_erythroblast_cell.chr21.bam bam_data/SRR2920504_CD71+GPA+_erythroblast_cell.chr21.bam bam_data/SRR2920505_granulocyte_macrophage_progenitor_cell.chr21.bam bam_data/SRR2920506_hematopoietic_stem_cell.chr21.bam bam_data/SRR2920507_hematopoietic_stem_cell.chr21.bam bam_data/SRR2920508_megakaryocyte_erythroid_progenitor_cell.chr21.bam bam_data/SRR2920509_multipotent_progenitor_cell.chr21.bam bam_data/SRR2920510_multipotent_progenitor_cell.chr21.bam bam_data/SRR2920511_CD56+_natural_killer_cell.chr21.bam bam_data/SRR2920512_CD56+_natural_killer_cell.chr21.bam bam_data/SRR2920513_CD19+CD20+_B_cell.chr21.bam bam_data/SRR2920514_CD4+_T_cell.chr21.bam bam_data/SRR2920515_CD8+_T_cell.chr21.bam bam_data/SRR2920516_CD56+_natural_killer_cell.chr21.bam bam_data/SRR2920517_CD19+CD20+_B_cell.chr21.bam bam_data/SRR2920518_CD4+_T_cell.chr21.bam bam_data/SRR2920519_CD4+_T_cell.chr21.bam bam_data/SRR2920520_CD8+_T_cell.chr21.bam bam_data/SRR2920521_CD8+_T_cell.chr21.bam bam_data/SRR2920522_common_lymphoid_progenitor_cell.chr21.bam bam_data/SRR2920523_CD71+GPA+_erythroblast_cell.chr21.bam bam_data/SRR2920524_CD71+GPA+_erythroblast_cell.chr21.bam bam_data/SRR2920525_CD71+GPA+_erythroblast_cell.chr21.bam bam_data/SRR2920526_CD56+_natural_killer_cell.chr21.bam bam_data/SRR2920527_CD56+_natural_killer_cell.chr21.bam bam_data/SRR2920528_common_lymphoid_progenitor_cell.chr21.bam bam_data/SRR2920529_CD71+GPA+_erythroblast_cell.chr21.bam bam_data/SRR2920530_CD71+GPA+_erythroblast_cell.chr21.bam bam_data/SRR2920531_hematopoietic_stem_cell.chr21.bam bam_data/SRR2920532_hematopoietic_stem_cell.chr21.bam bam_data/SRR2920533_multipotent_progenitor_cell.chr21.bam bam_data/SRR2920534_multipotent_progenitor_cell.chr21.bam bam_data/SRR2920535_lymphoid-primed_multipotent_progenitor_cell.chr21.bam bam_data/SRR2920536_common_myeloid_progenitor_cell.chr21.bam bam_data/SRR2920537_common_myeloid_progenitor_cell.chr21.bam bam_data/SRR2920538_granulocyte_macrophage_progenitor_cell.chr21.bam bam_data/SRR2920539_granulocyte_macrophage_progenitor_cell.chr21.bam bam_data/SRR2920540_megakaryocyte_erythroid_progenitor_cell.chr21.bam bam_data/SRR2920541_megakaryocyte_erythroid_progenitor_cell.chr21.bam bam_data/SRR2920542_CD14+_monocyte_cell.chr21.bam bam_data/SRR2920543_CD14+_monocyte_cell.chr21.bam bam_data/SRR2920544_CD19+CD20+_B_cell.chr21.bam bam_data/SRR2920545_common_lymphoid_progenitor_cell.chr21.bam -o result.npz -bs 50000 -r chr21 -p 2"
        User time (seconds): 190.36
        System time (seconds): 1.35
        Percent of CPU this job got: 179%
        Elapsed (wall clock) time (h:mm:ss or m:ss): 1:46.77
        Average shared text size (kbytes): 0
        Average unshared data size (kbytes): 0
        Average stack size (kbytes): 0
        Average total size (kbytes): 0
        Maximum resident set size (kbytes): 73244
        Average resident set size (kbytes): 0
        Major (requiring I/O) page faults: 0
        Minor (reclaiming a frame) page faults: 160349
        Voluntary context switches: 612
        Involuntary context switches: 282
        Swaps: 0
        File system inputs: 0
        File system outputs: 0
        Socket messages sent: 0
        Socket messages received: 0
        Signals delivered: 0
        Page size (bytes): 4096
        Exit status: 0
Step 2. Make some plots based on the count matrix
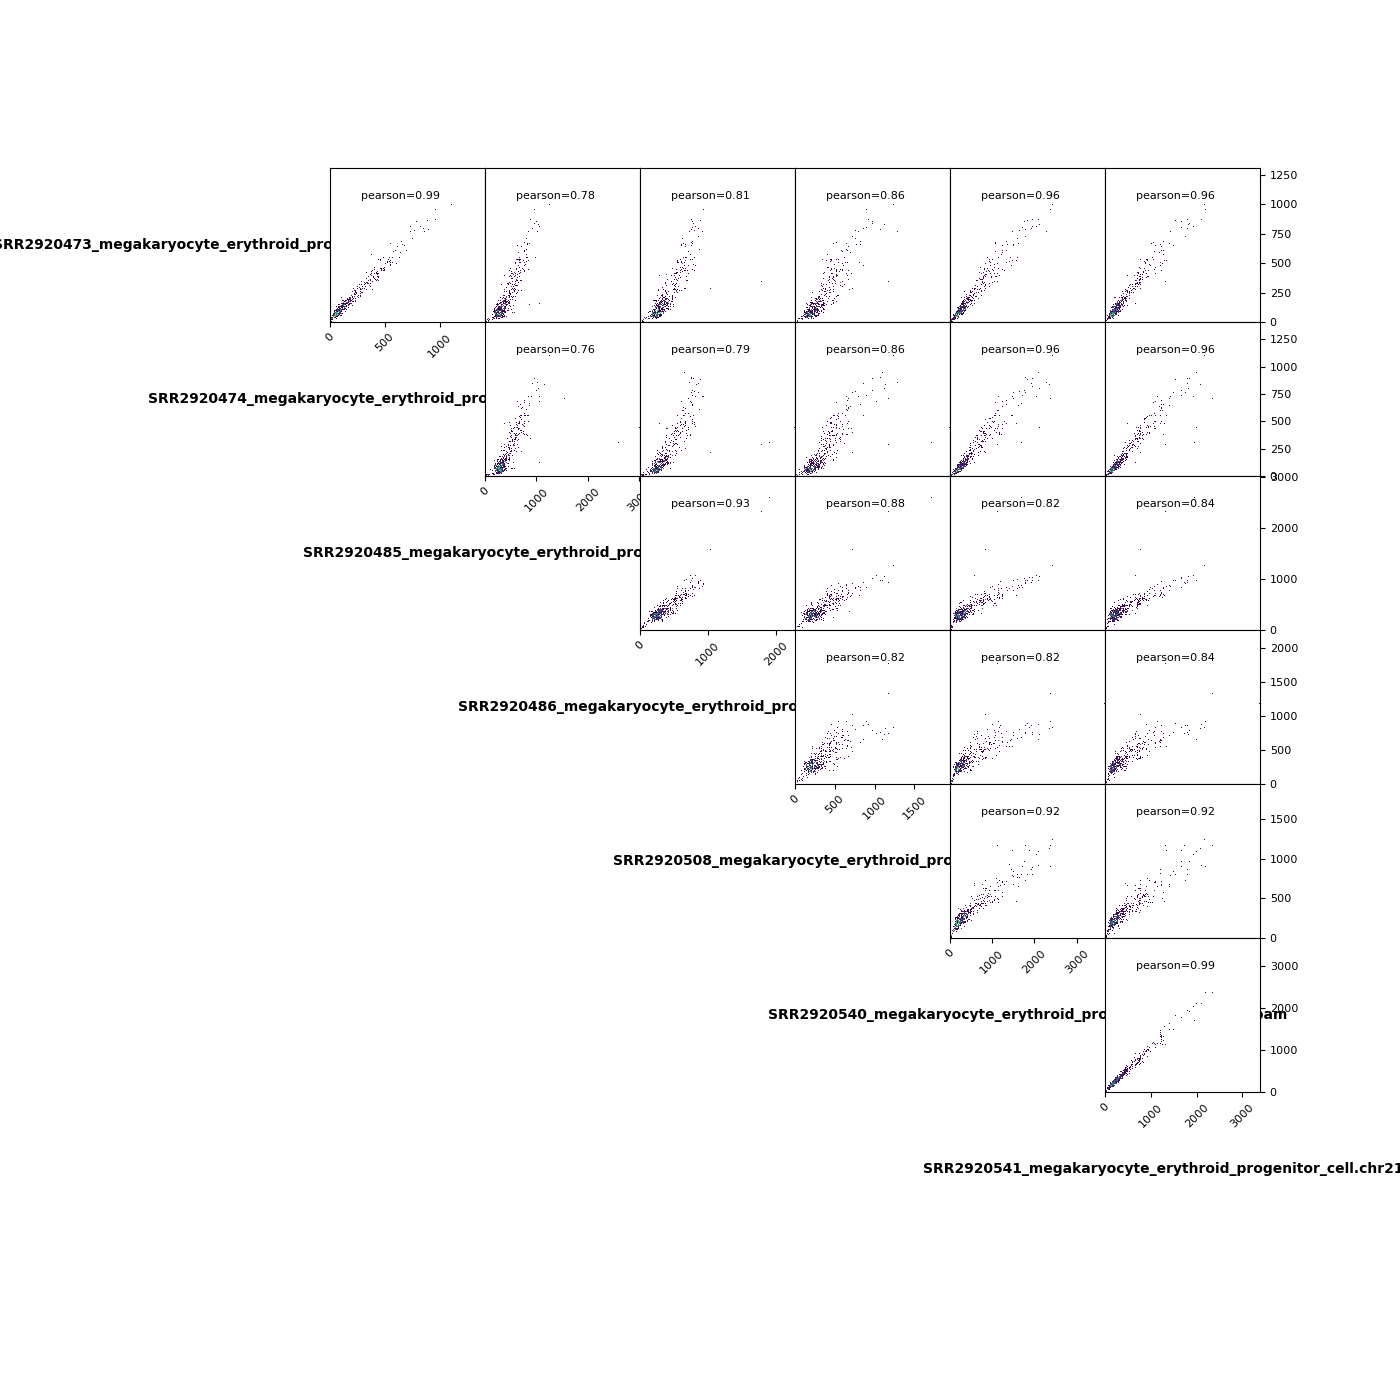
A pairwise scatter plot
[110]:
# pairwise scatter plot for 50+ samples is very slow to plot
# !plotCorrelation -in result.npz -p scatterplot \
# --corMethod pearson --skipZeros \
# -o multiBamSummary.plotProfile.Pearson.skip_zero.png \
# --outFileCorMatrix test.tab
[14]:
!multiBamSummary bins -b bam_data/*megakaryocyte_erythroid_progenitor_cell*bam -o MEP.npz -bs 50000 -r chr21 -p 2
Number of bins found: 962
[15]:
!plotCorrelation -in MEP.npz -p scatterplot \
--corMethod pearson --skipZeros \
-o MEP.multiBamSummary.plotProfile.Pearson.skip_zero.png \
--outFileCorMatrix test.tab
[16]:
from IPython.display import Image
Image("MEP.multiBamSummary.plotProfile.Pearson.skip_zero.png")
[16]:
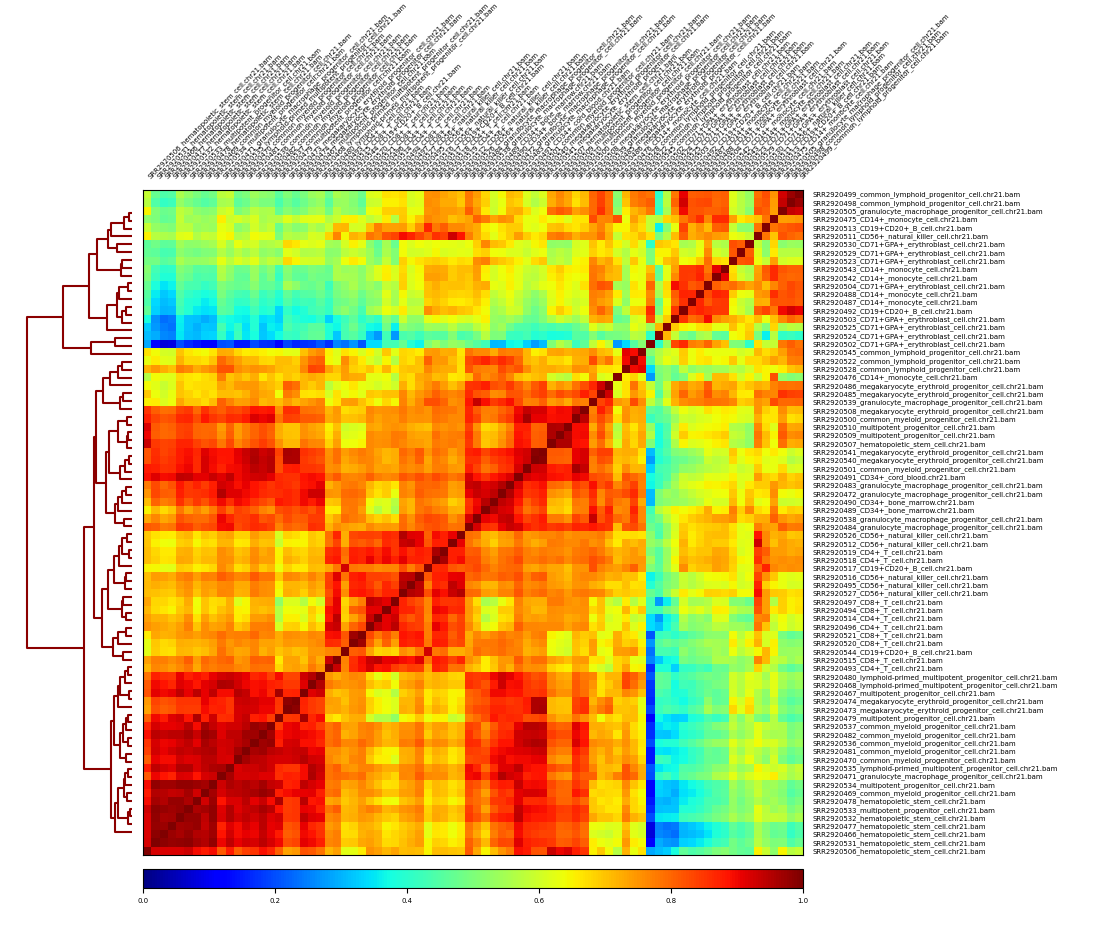
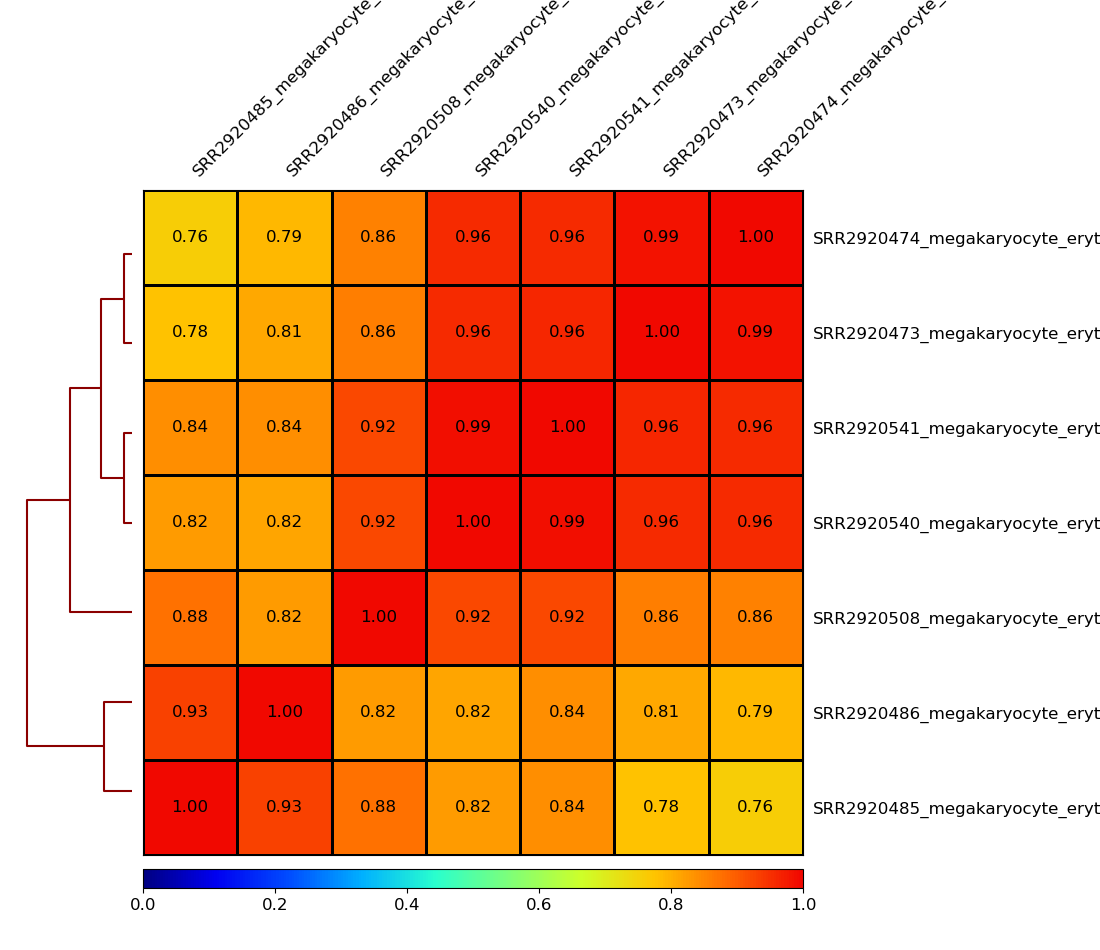
A heatmap plot
[12]:
!plotCorrelation -in result.npz -p heatmap \
--corMethod pearson --skipZeros \
-o multiBamSummary.plotProfile.Pearson.skip_zero.png \
--outFileCorMatrix test.tab
[13]:
from IPython.display import Image
Image("multiBamSummary.plotProfile.Pearson.skip_zero.png")
[13]:
[19]:
!plotCorrelation -in MEP.npz -p heatmap \
--corMethod pearson --skipZeros \
--plotNumbers \
-o MEP.multiBamSummary.plotProfile.Pearson.skip_zero.png \
--outFileCorMatrix test.tab
Image("MEP.multiBamSummary.plotProfile.Pearson.skip_zero.png")
[19]:
[21]:
!plotCorrelation -in MEP.npz -p heatmap \
--corMethod pearson --skipZeros \
--plotNumbers -min 0.6 -max 1 \
-o MEP.multiBamSummary.plotProfile.Pearson.skip_zero.png \
--outFileCorMatrix test.tab
Image("MEP.multiBamSummary.plotProfile.Pearson.skip_zero.png")
[21]:
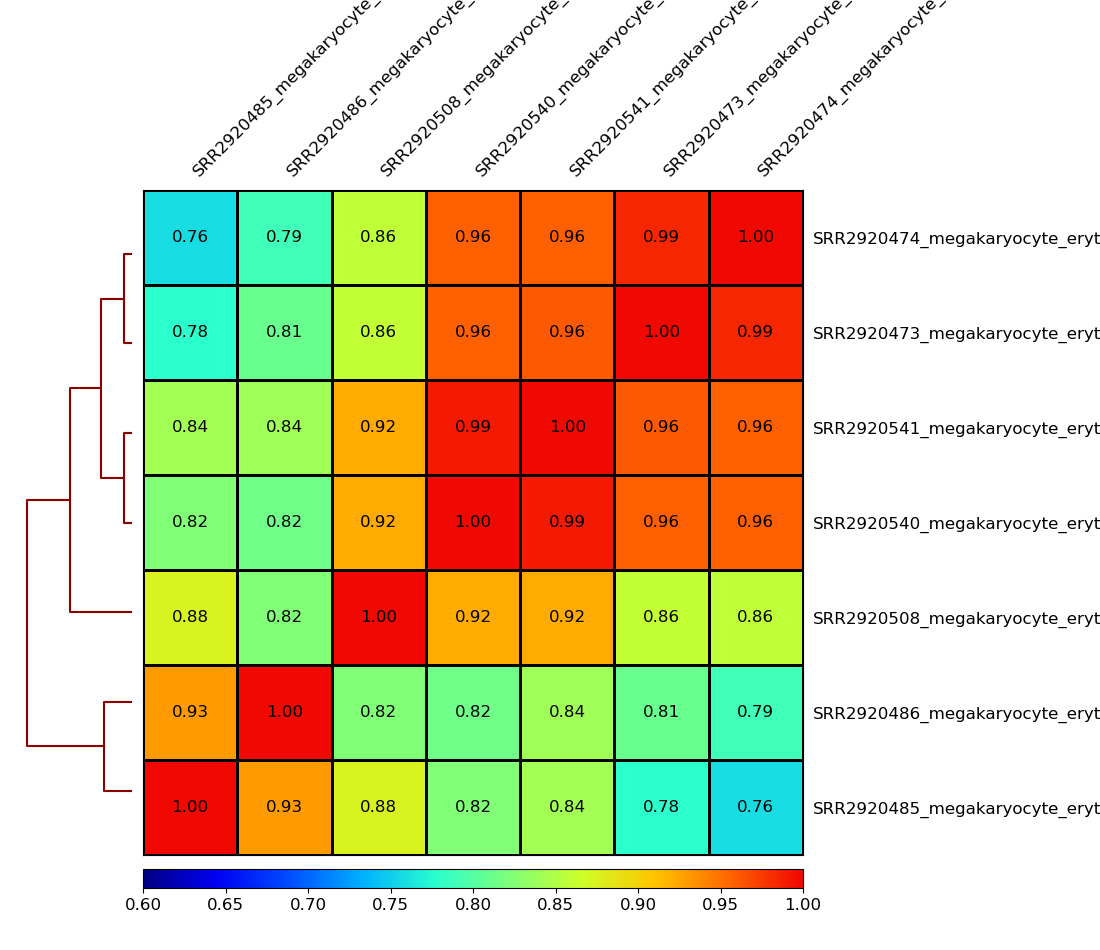
You can use --plotFileFormat to create pdf or svg files
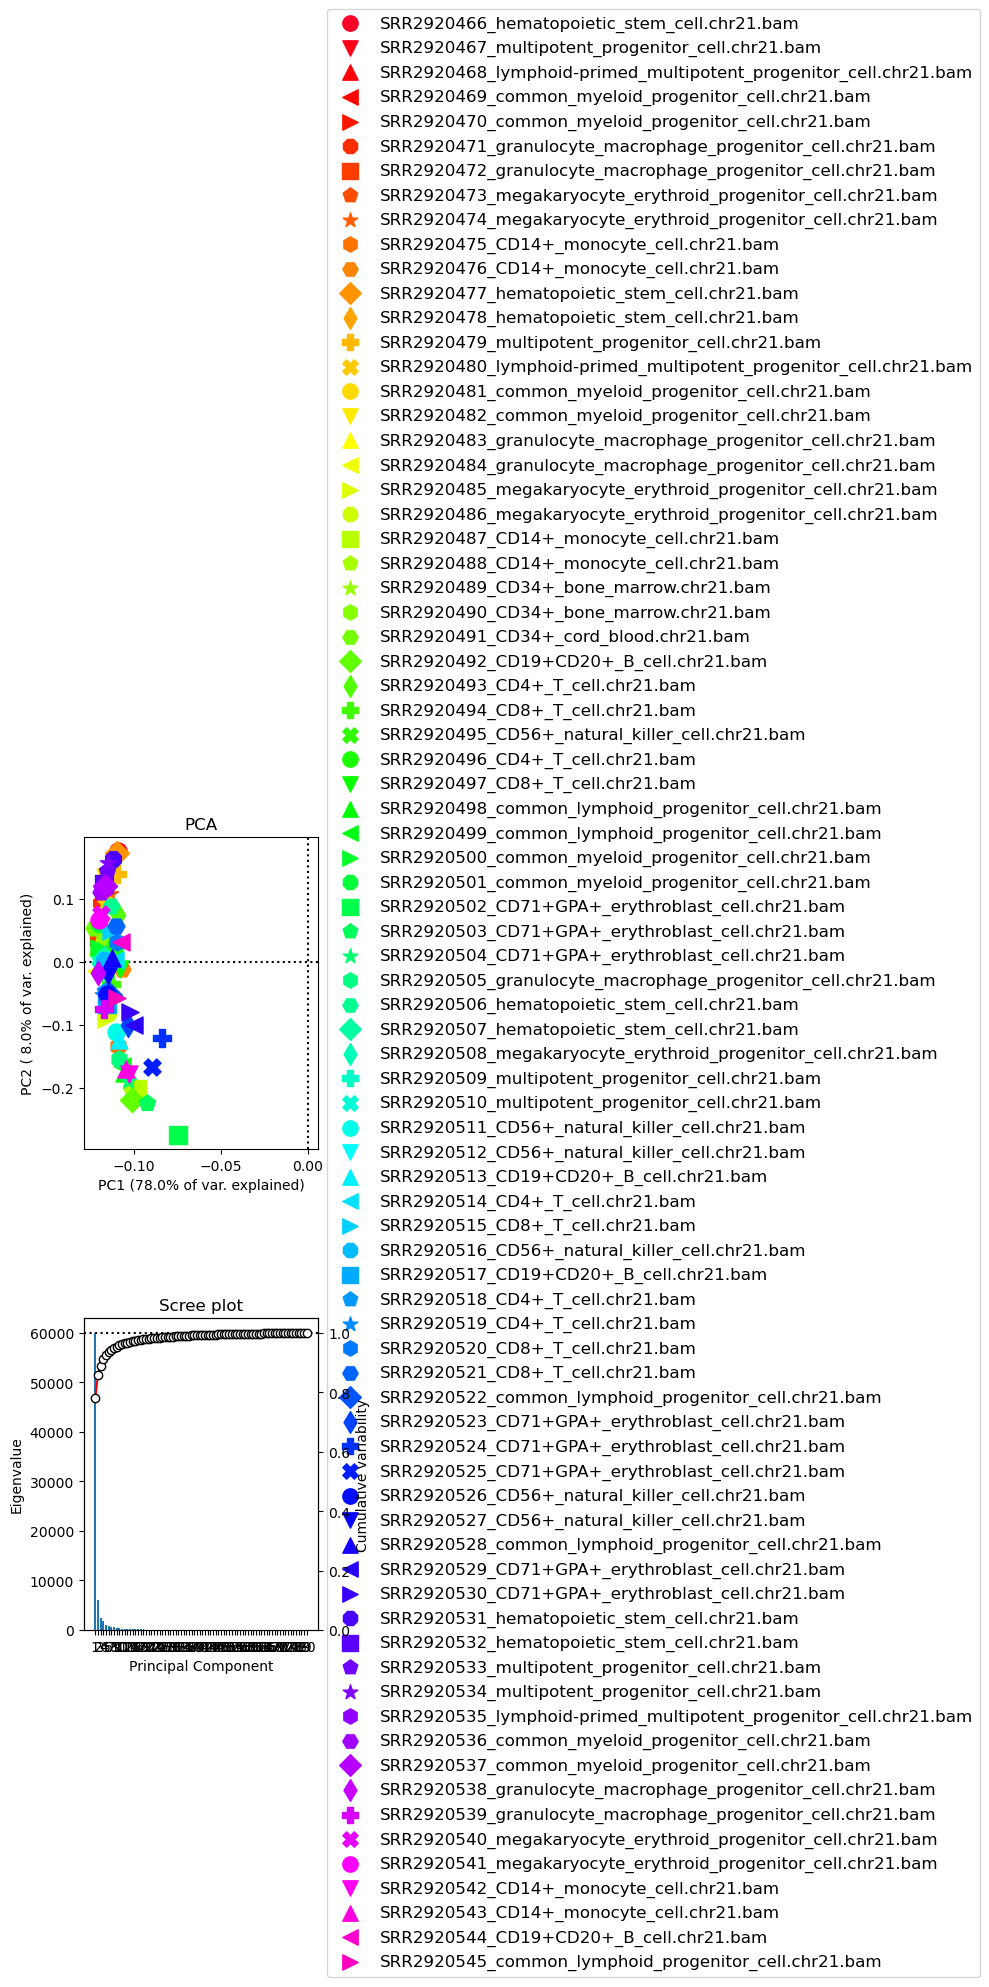
PCA plot
[22]:
!plotPCA -in result.npz \
-o PCA_readCounts.png
Image("PCA_readCounts.png")
[22]:
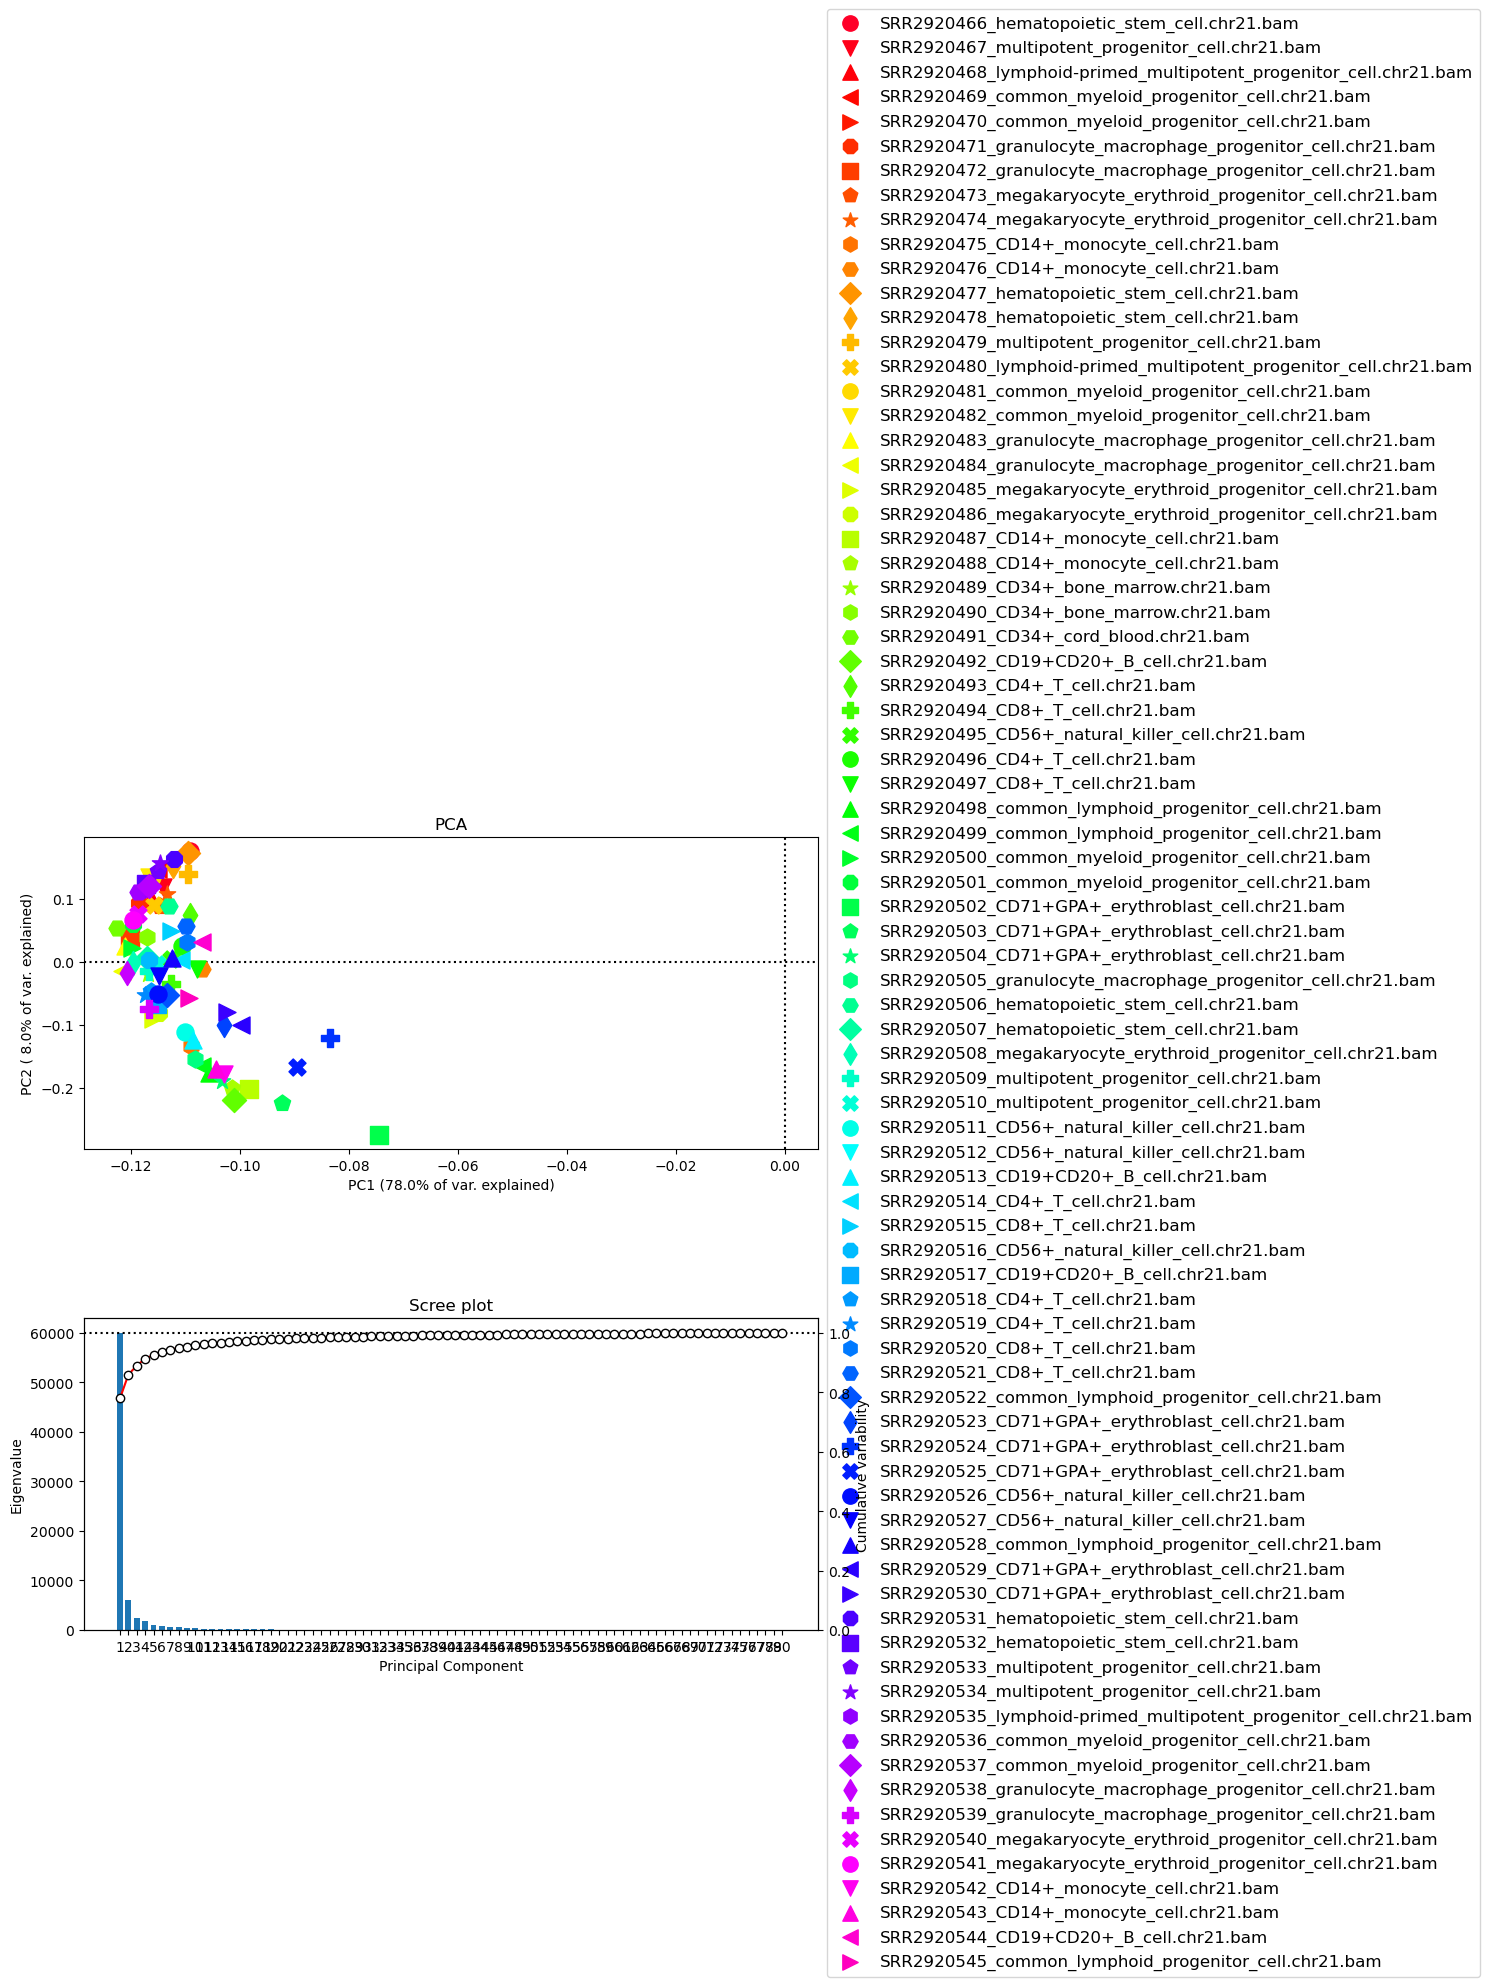
[42]:
!plotPCA -in result.npz \
-o PCA_readCounts.png \
--plotWidth 15
Image("PCA_readCounts.png")
[42]:
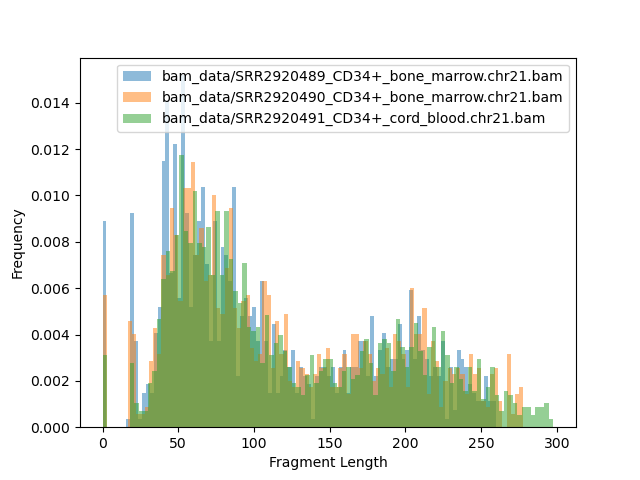
Distribution of fragment size
[71]:
!bamPEFragmentSize -o fragment.png -b bam_data/*CD34*bam -p 20 \
-bs 10 \
-bl hg19_main.chrom_sizes.bed
Image("fragment.png")
BAM file : bam_data/SRR2920489_CD34+_bone_marrow.chr21.bam
Sample size: 1141

Fragment lengths:
Min.: 0.0
1st Qu.: 56.0
Mean: 129.88869412795793
Median: 97.0
3rd Qu.: 192.0
Max.: 570.0
Std: 95.95941509994078
MAD: 53.0
Len. 10%: 40.0
Len. 20%: 51.0
Len. 30%: 63.0
Len. 40%: 79.0
Len. 60%: 128.0
Len. 70%: 175.0
Len. 80%: 206.0
Len. 90%: 251.0
Len. 99%: 440.7999999999997


Read lengths:
Sample size: 1141

Min.: 30.0
1st Qu.: 64.0
Mean: 68.61174408413672
Median: 76.0
3rd Qu.: 76.0
Max.: 76.0
Std: 12.357620415026776
MAD: 0.0
Len. 10%: 46.0
Len. 20%: 57.0
Len. 30%: 69.0
Len. 40%: 76.0
Len. 60%: 76.0
Len. 70%: 76.0
Len. 80%: 76.0
Len. 90%: 76.0
Len. 99%: 76.0


BAM file : bam_data/SRR2920490_CD34+_bone_marrow.chr21.bam
Sample size: 1376

Fragment lengths:
Min.: 0.0
1st Qu.: 62.0
Mean: 138.97238372093022
Median: 108.0
3rd Qu.: 202.0
Max.: 870.0
Std: 99.21099692957296
MAD: 57.5
Len. 10%: 44.0
Len. 20%: 57.0
Len. 30%: 69.5
Len. 40%: 85.0
Len. 60%: 144.0
Len. 70%: 183.4999999999999
Len. 80%: 215.0
Len. 90%: 268.0
Len. 99%: 416.25


Read lengths:
Sample size: 1376

Min.: 26.0
1st Qu.: 66.0
Mean: 69.58212209302326
Median: 76.0
3rd Qu.: 76.0
Max.: 76.0
Std: 11.634161812443411
MAD: 0.0
Len. 10%: 49.0
Len. 20%: 61.0
Len. 30%: 75.0
Len. 40%: 76.0
Len. 60%: 76.0
Len. 70%: 76.0
Len. 80%: 76.0
Len. 90%: 76.0
Len. 99%: 76.0


BAM file : bam_data/SRR2920491_CD34+_cord_blood.chr21.bam
Sample size: 2162

Fragment lengths:
Min.: 0.0
1st Qu.: 66.0
Mean: 148.88482886216465
Median: 110.5
3rd Qu.: 208.0
Max.: 607.0
Std: 107.94168844664091
MAD: 59.0
Len. 10%: 47.0
Len. 20%: 60.0
Len. 30%: 73.0
Len. 40%: 87.0
Len. 60%: 152.0
Len. 70%: 193.0
Len. 80%: 225.80000000000018
Len. 90%: 297.8000000000002
Len. 99%: 479.77999999999975


Read lengths:
Sample size: 2162

Min.: 28.0
1st Qu.: 73.0
Mean: 70.43848288621646
Median: 76.0
3rd Qu.: 76.0
Max.: 76.0
Std: 10.954120075776784
MAD: 0.0
Len. 10%: 51.0
Len. 20%: 65.0
Len. 30%: 76.0
Len. 40%: 76.0
Len. 60%: 76.0
Len. 70%: 76.0
Len. 80%: 76.0
Len. 90%: 76.0
Len. 99%: 76.0
[71]:
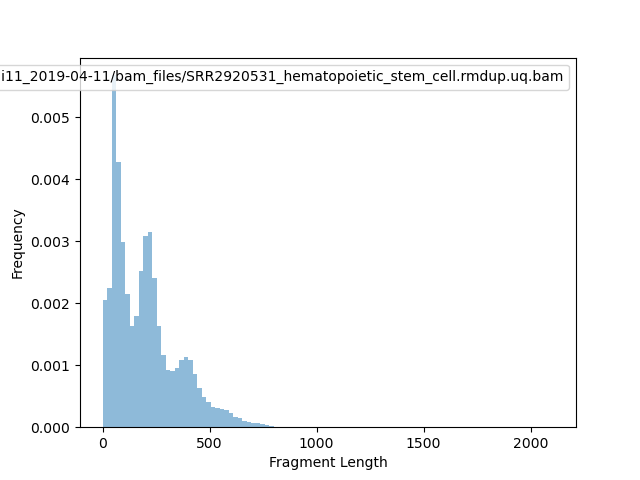
[66]:
!bamPEFragmentSize -o fragment2.png \
-bs 10000 \
-b /home/yli11/dirs/blood_regulome/chenggrp/Projects/bone_marrow_ATAC_seq/data/PRJNA301969_HemTools/atac_seq_yli11_2019-04-11/bam_files/SRR2920531_hematopoietic_stem_cell.rmdup.uq.bam \
-p 20
Image("fragment2.png")
BAM file : /home/yli11/dirs/blood_regulome/chenggrp/Projects/bone_marrow_ATAC_seq/data/PRJNA301969_HemTools/atac_seq_yli11_2019-04-11/bam_files/SRR2920531_hematopoietic_stem_cell.rmdup.uq.bam
Sample size: 169260

Fragment lengths:
Min.: 0.0
1st Qu.: 72.0
Mean: 1053.2384910788137
Median: 177.0
3rd Qu.: 273.0
Max.: 144448594.0
Std: 351102.81160631403
MAD: 103.0
Len. 10%: 44.0
Len. 20%: 62.0
Len. 30%: 84.0
Len. 40%: 122.0
Len. 60%: 211.0
Len. 70%: 245.0
Len. 80%: 322.0
Len. 90%: 418.0
Len. 99%: 650.0


Read lengths:
Sample size: 169260

Min.: 21.0
1st Qu.: 76.0
Mean: 70.51103036748198
Median: 76.0
3rd Qu.: 76.0
Max.: 76.0
Std: 11.105600025298877
MAD: 0.0
Len. 10%: 50.0
Len. 20%: 66.0
Len. 30%: 76.0
Len. 40%: 76.0
Len. 60%: 76.0
Len. 70%: 76.0
Len. 80%: 76.0
Len. 90%: 76.0
Len. 99%: 76.0
[66]:
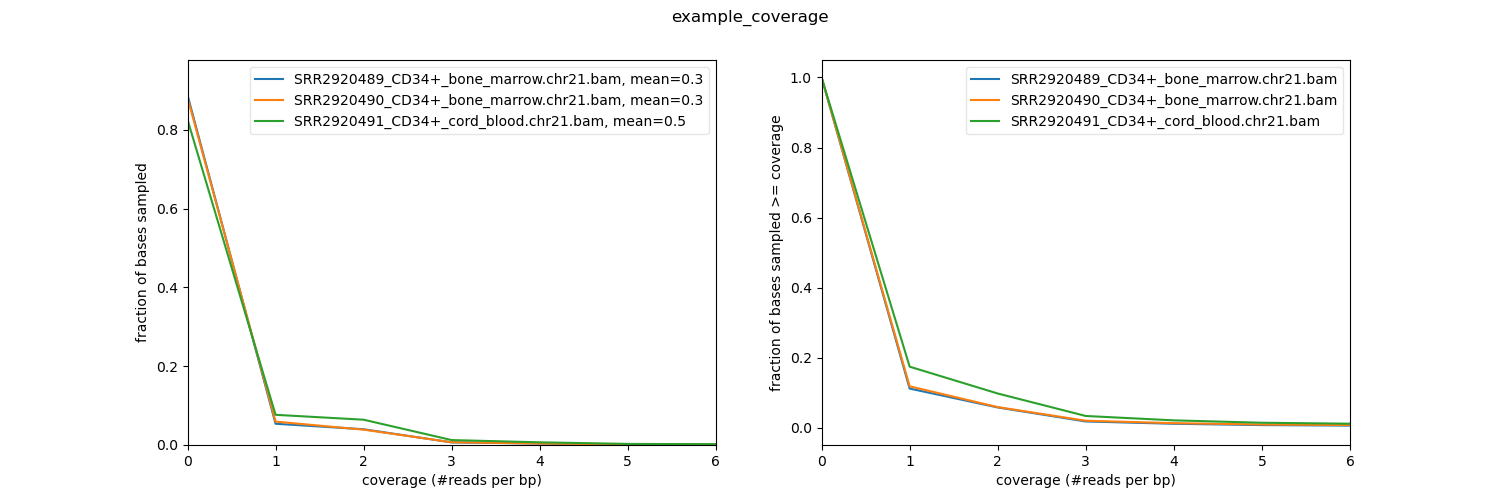
Distribution of read coverage
[56]:
!plotCoverage -b bam_data/*CD34*bam \
    -p 20 \
    -o coverage.png \
    --plotTitle "example_coverage" \
    --outRawCounts coverage.tab \
    -r chr21
sample  mean    std     min     25%     50%     75%     max
SRR2920489_CD34+_bone_marrow.chr21.bam  0.25    1.60    0       0.0     0.0     0.0     376
SRR2920490_CD34+_bone_marrow.chr21.bam  0.30    2.09    0       0.0     0.0     0.0     334
SRR2920491_CD34+_cord_blood.chr21.bam   0.49    3.27    0       0.0     0.0     0.0     425
[57]:
Image("coverage.png")
[57]:
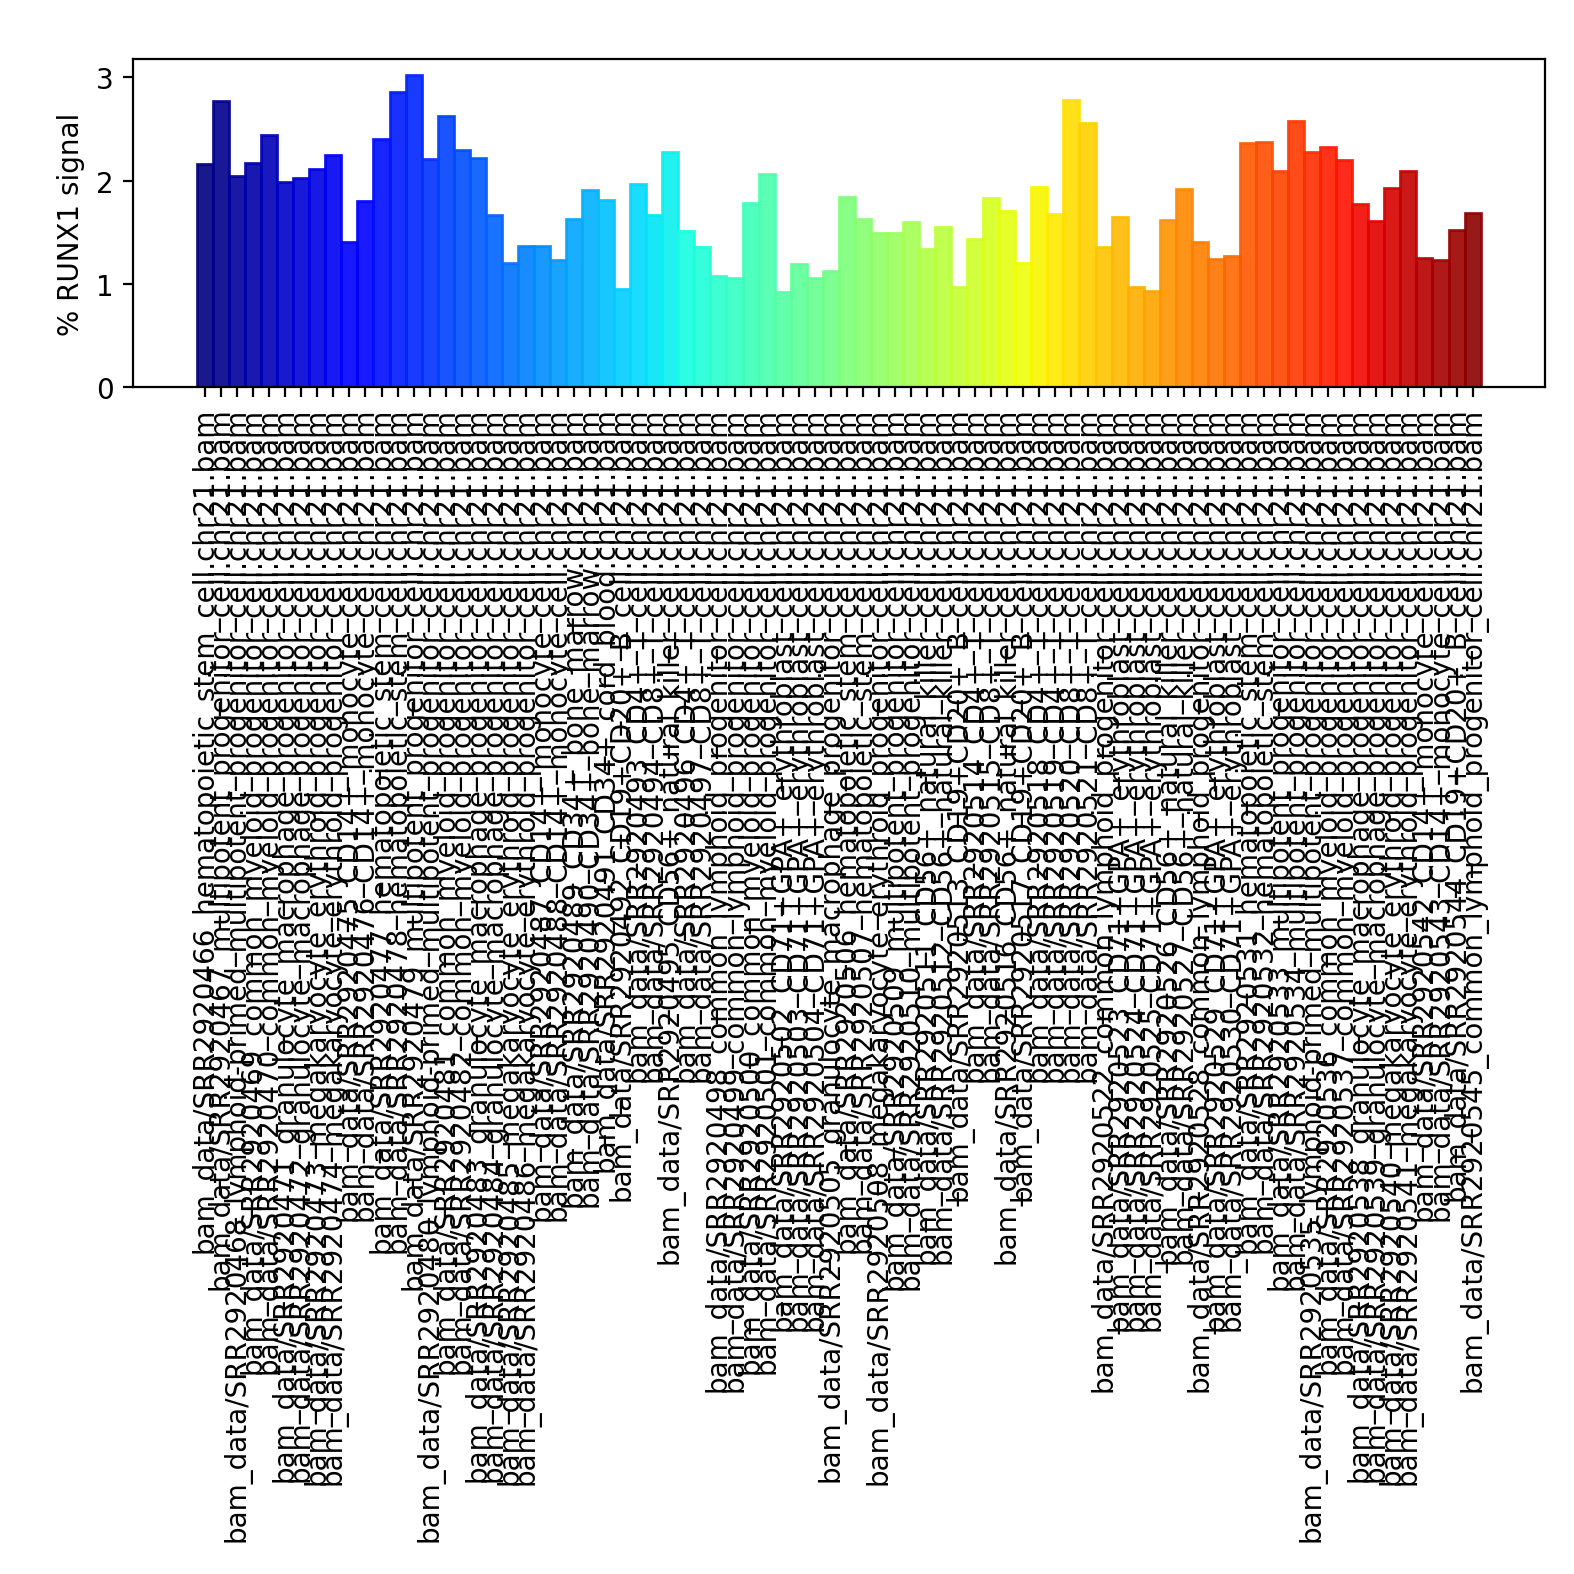
Barplot: Comparing average signal on a region or some regions
[53]:
!plotEnrichment -b bam_data/*bam \
--BED runx1.bed \
--regionLabels "RUNX1 signal" \
-o enrichment.png \
-p 20 \
--variableScales \
--outRawCounts outRawCounts.tsv
Image("enrichment.png")
[53]:
Convert bam to bw file
[59]:
!bamCoverage --bam bam_data/SRR2920490_CD34+_bone_marrow.chr21.bam \
    -o CD34.bw \
    --binSize 50 \
    --ignoreForNormalization chrX \
    --extendReads \
    -p 10
bamFilesList: ['bam_data/SRR2920490_CD34+_bone_marrow.chr21.bam']
binLength: 50
numberOfSamples: None
blackListFileName: None
skipZeroOverZero: False
bed_and_bin: False
genomeChunkSize: None
defaultFragmentLength: 80
numberOfProcessors: 10
verbose: False
region: None
bedFile: None
minMappingQuality: None
ignoreDuplicates: False
chrsToSkip: ['chrX']
stepSize: 50
center_read: False
samFlag_include: None
samFlag_exclude: None
minFragmentLength: 0
maxFragmentLength: 0
zerosToNans: False
smoothLength: None
save_data: False
out_file_for_raw_data: None
maxPairedFragmentLength: 320
[60]:
!bamCoverage --bam bam_data/SRR2920502_CD71+GPA+_erythroblast_cell.chr21.bam \
    -o CD71.bw \
    --binSize 50 \
    --ignoreForNormalization chrX \
    --extendReads \
    -p 10
bamFilesList: ['bam_data/SRR2920502_CD71+GPA+_erythroblast_cell.chr21.bam']
binLength: 50
numberOfSamples: None
blackListFileName: None
skipZeroOverZero: False
bed_and_bin: False
genomeChunkSize: None
defaultFragmentLength: 83
numberOfProcessors: 10
verbose: False
region: None
bedFile: None
minMappingQuality: None
ignoreDuplicates: False
chrsToSkip: ['chrX']
stepSize: 50
center_read: False
samFlag_include: None
samFlag_exclude: None
minFragmentLength: 0
maxFragmentLength: 0
zerosToNans: False
smoothLength: None
save_data: False
out_file_for_raw_data: None
maxPairedFragmentLength: 332
aggregated signal plot
Step 1. Compute count matrix
There are two modes:
centered at the input region(s)
bin and plot the entire input region(s)
[74]:
!computeMatrix reference-point \
--referencePoint center \
-a 5000 -b 5000 \
-R chr21.peak \
-S CD34.bw \
--skipZeros \
-p 20 \
-o test.gz
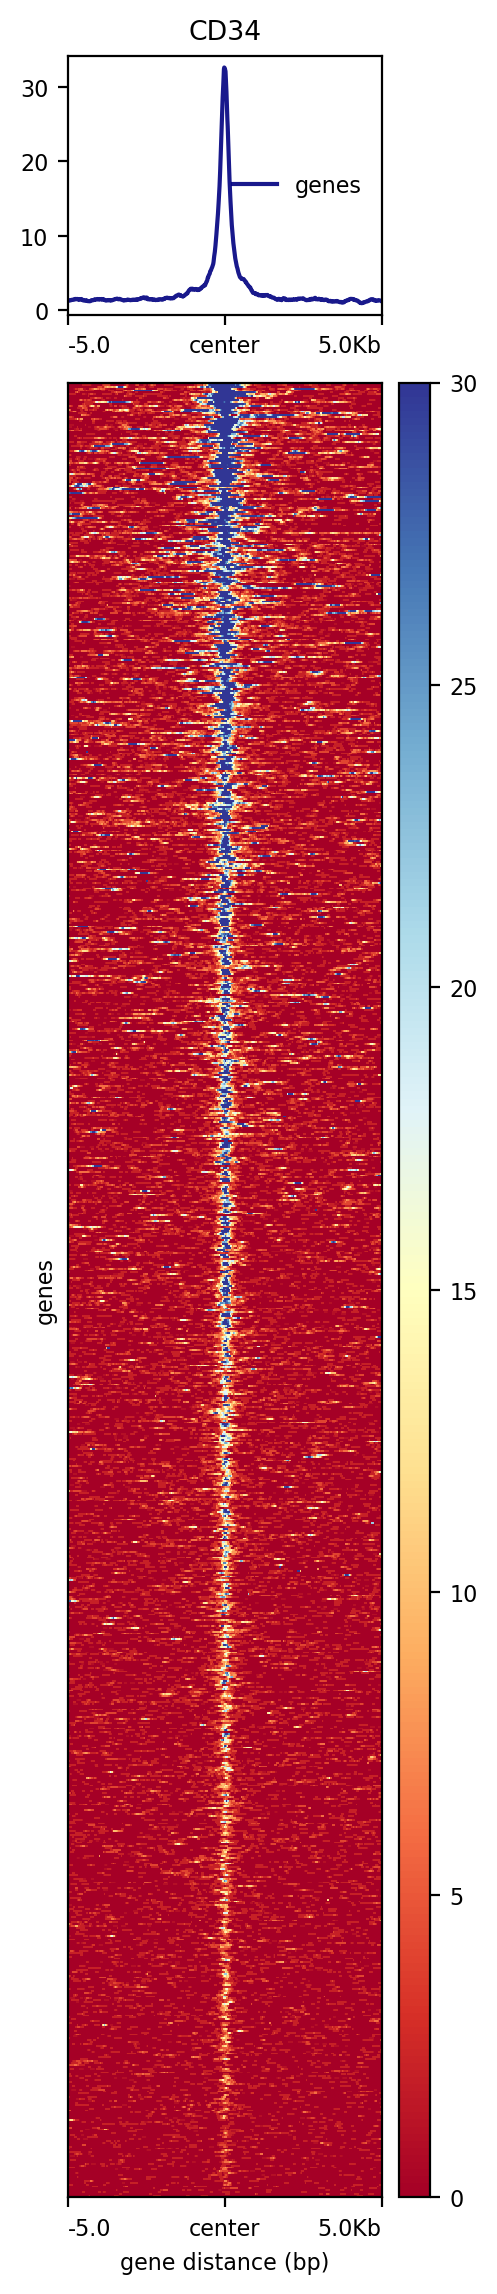
Step 2. Plot heatmap
[87]:
!plotHeatmap -m test.gz -out test.png
Image("test.png")
[87]:
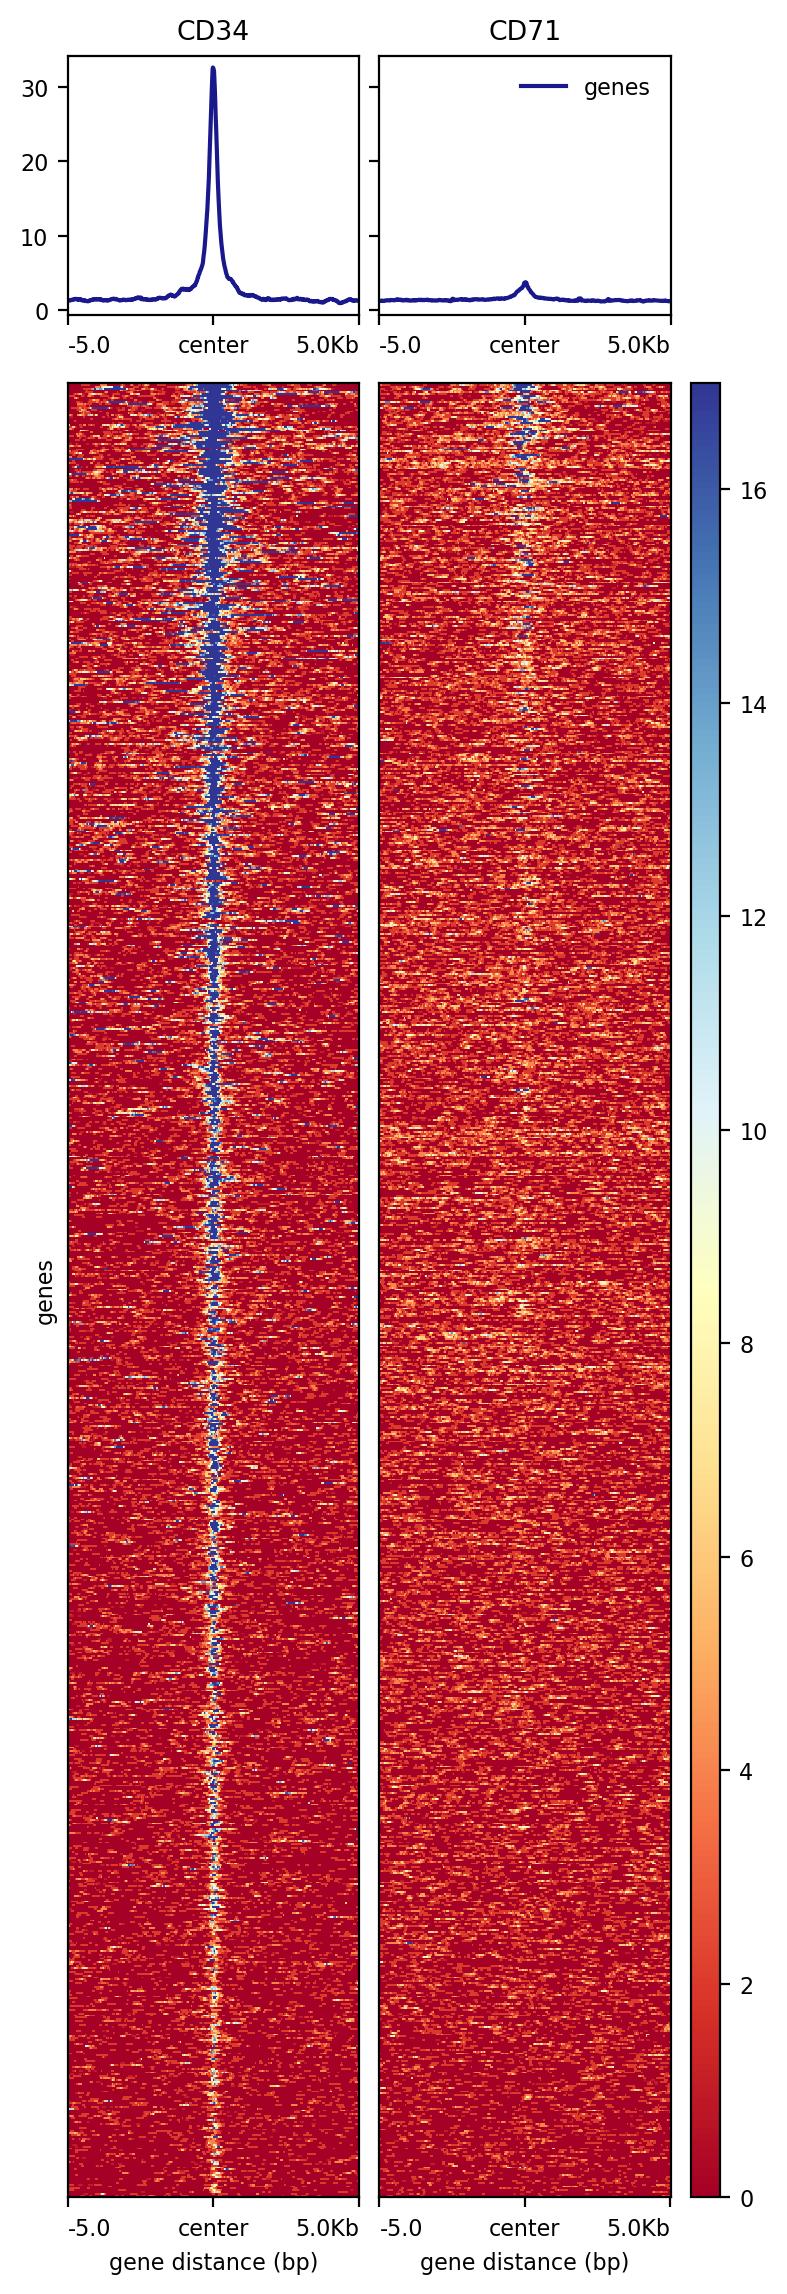
More examples
[88]:
!computeMatrix reference-point \
--referencePoint center \
-a 5000 -b 5000 \
-R chr21.peak \
-S CD34.bw CD71.bw\
--skipZeros \
-p 20 \
-o test.gz
[89]:
!plotHeatmap -m test.gz -out test.png
Image("test.png")
[89]:
[90]:
!plotProfile -m test.gz \
              -out test.png
Image("test.png")
[90]:
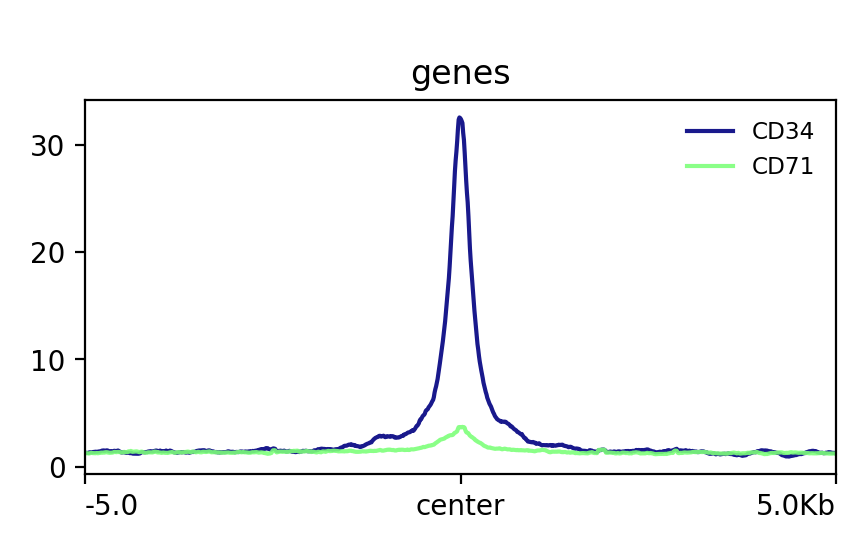
[91]:
!plotProfile -m test.gz --perGroup \
              -out test.png
Image("test.png")
[91]:
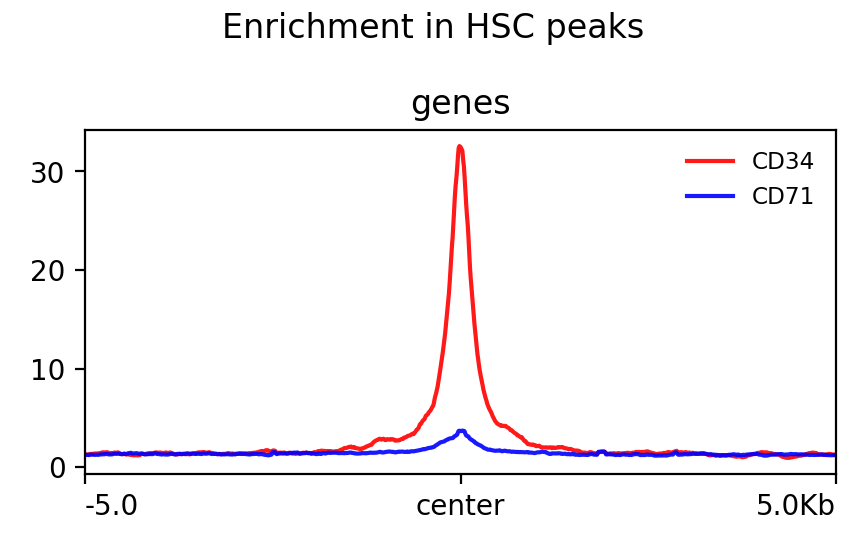
[94]:
!plotProfile -m test.gz --perGroup \
            --colors red blue \
            --plotTitle "Enrichment in HSC peaks" \
              -out test.png
Image("test.png")
[94]:
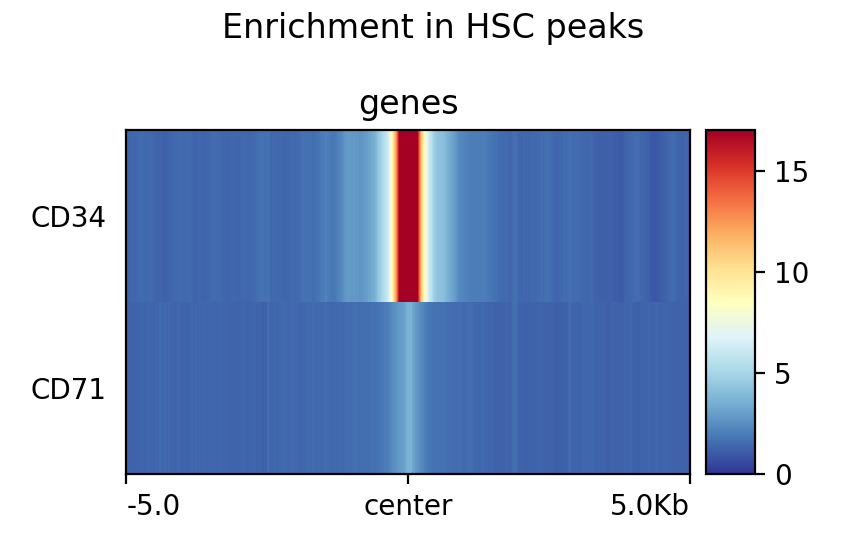
[97]:
!plotProfile -m test.gz --perGroup \
            --plotType heatmap \
            --plotTitle "Enrichment in HSC peaks" \
              -out test.png
Image("test.png")
[97]:
[98]:
!plotHeatmap -m test.gz -out test.png --perGroup
Image("test.png")
[98]:
Default plot is per bed file, use --perGroup will make the plot per bw file
2 bw and 2 bed files
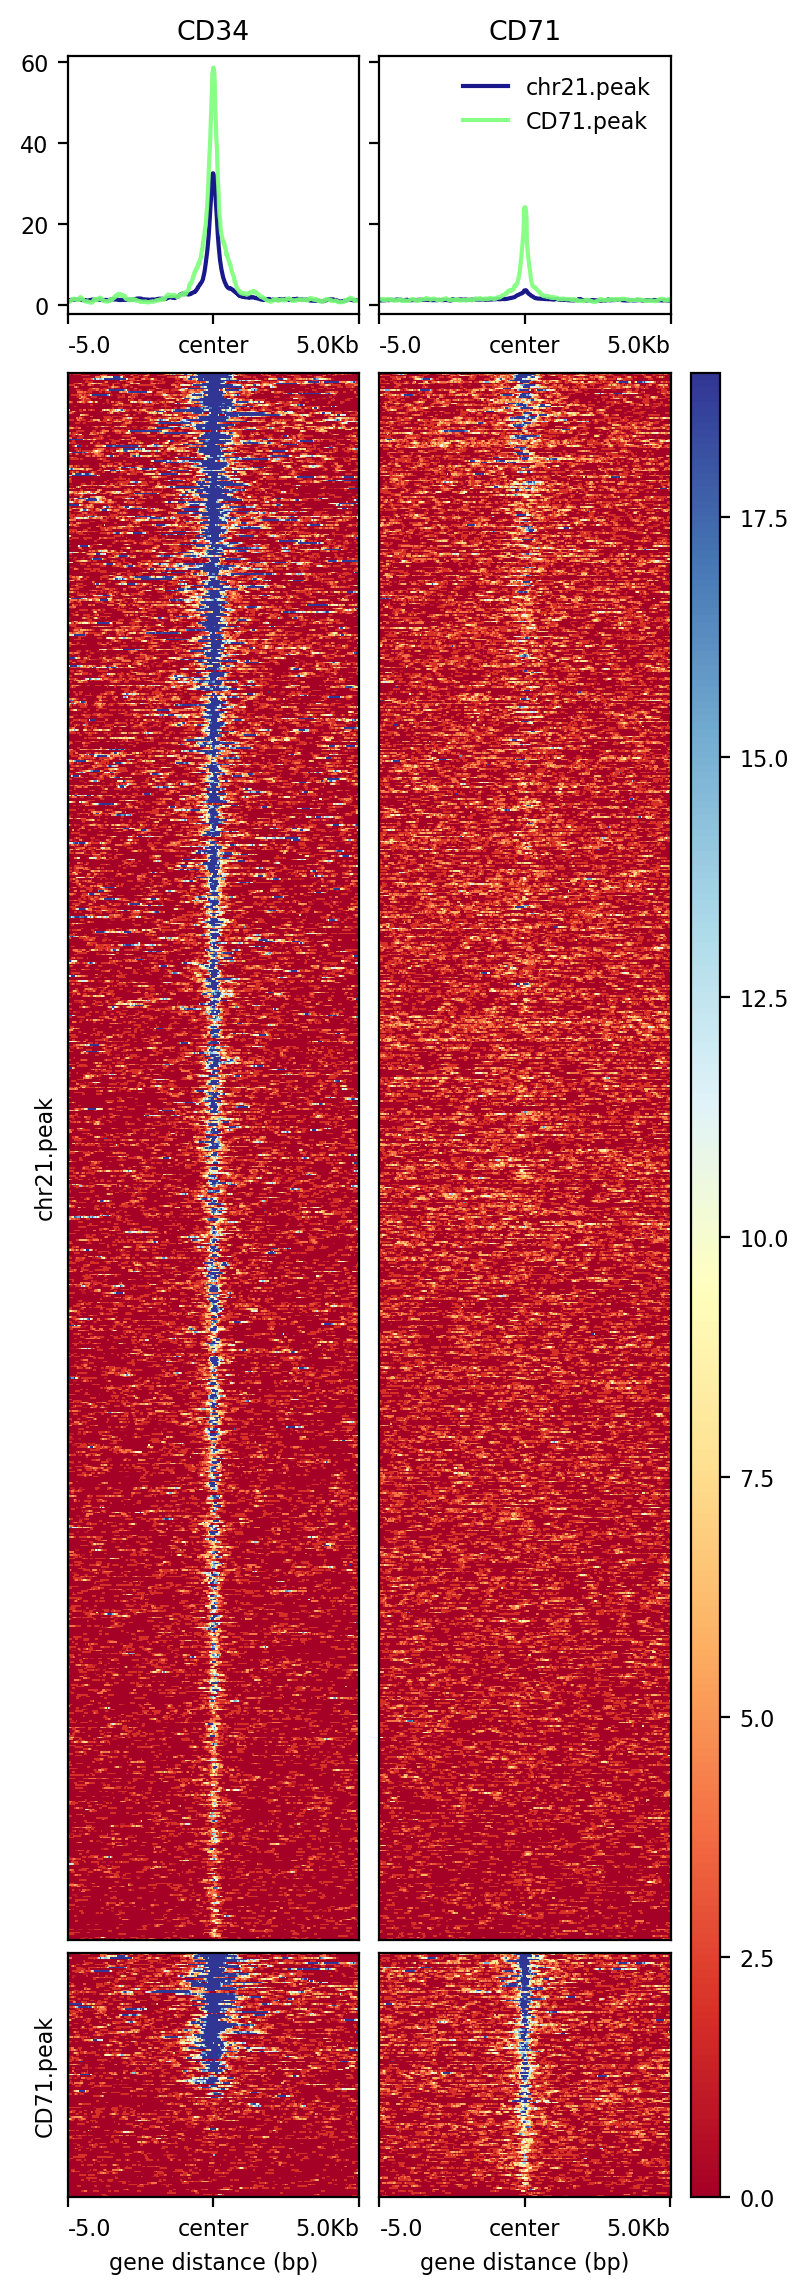
[100]:
!computeMatrix reference-point \
--referencePoint center \
-a 5000 -b 5000 \
-R chr21.peak CD71.peak \
-S CD34.bw CD71.bw \
--skipZeros \
-p 20 \
-o test2.gz
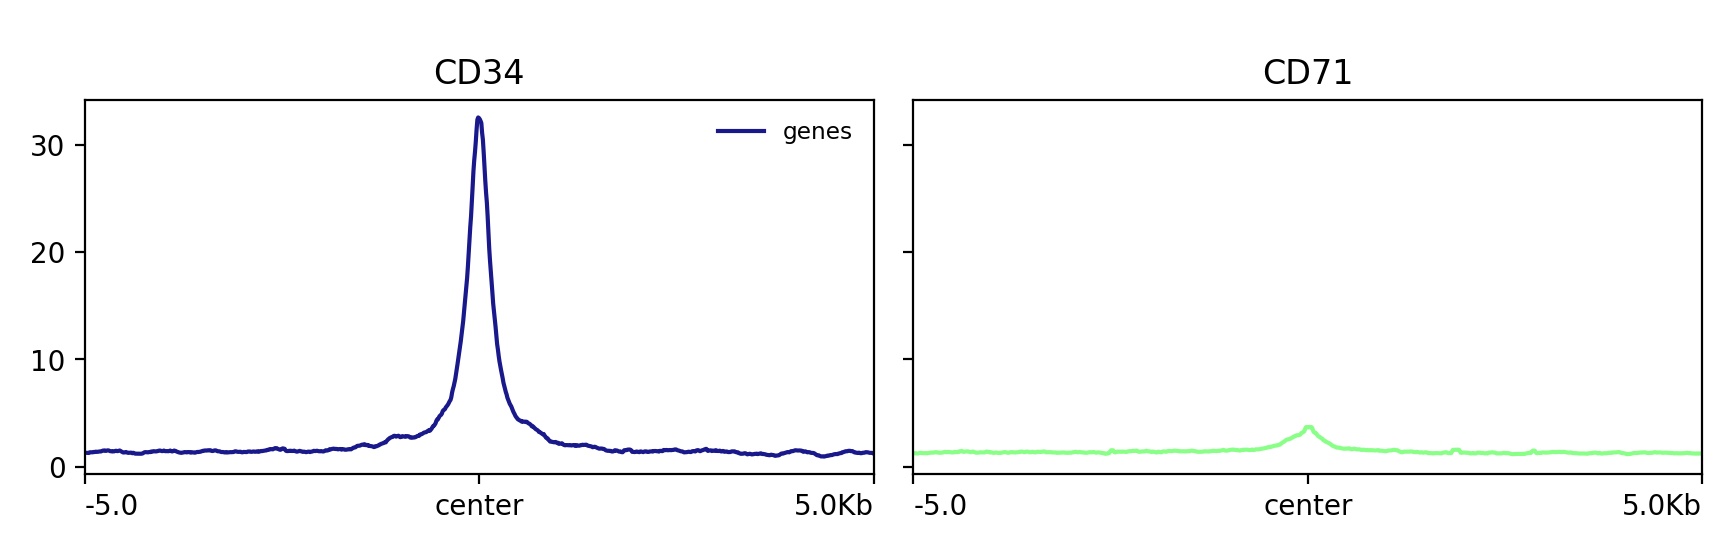
[101]:
!plotHeatmap -m test2.gz -out test2.png
Image("test2.png")
[101]:
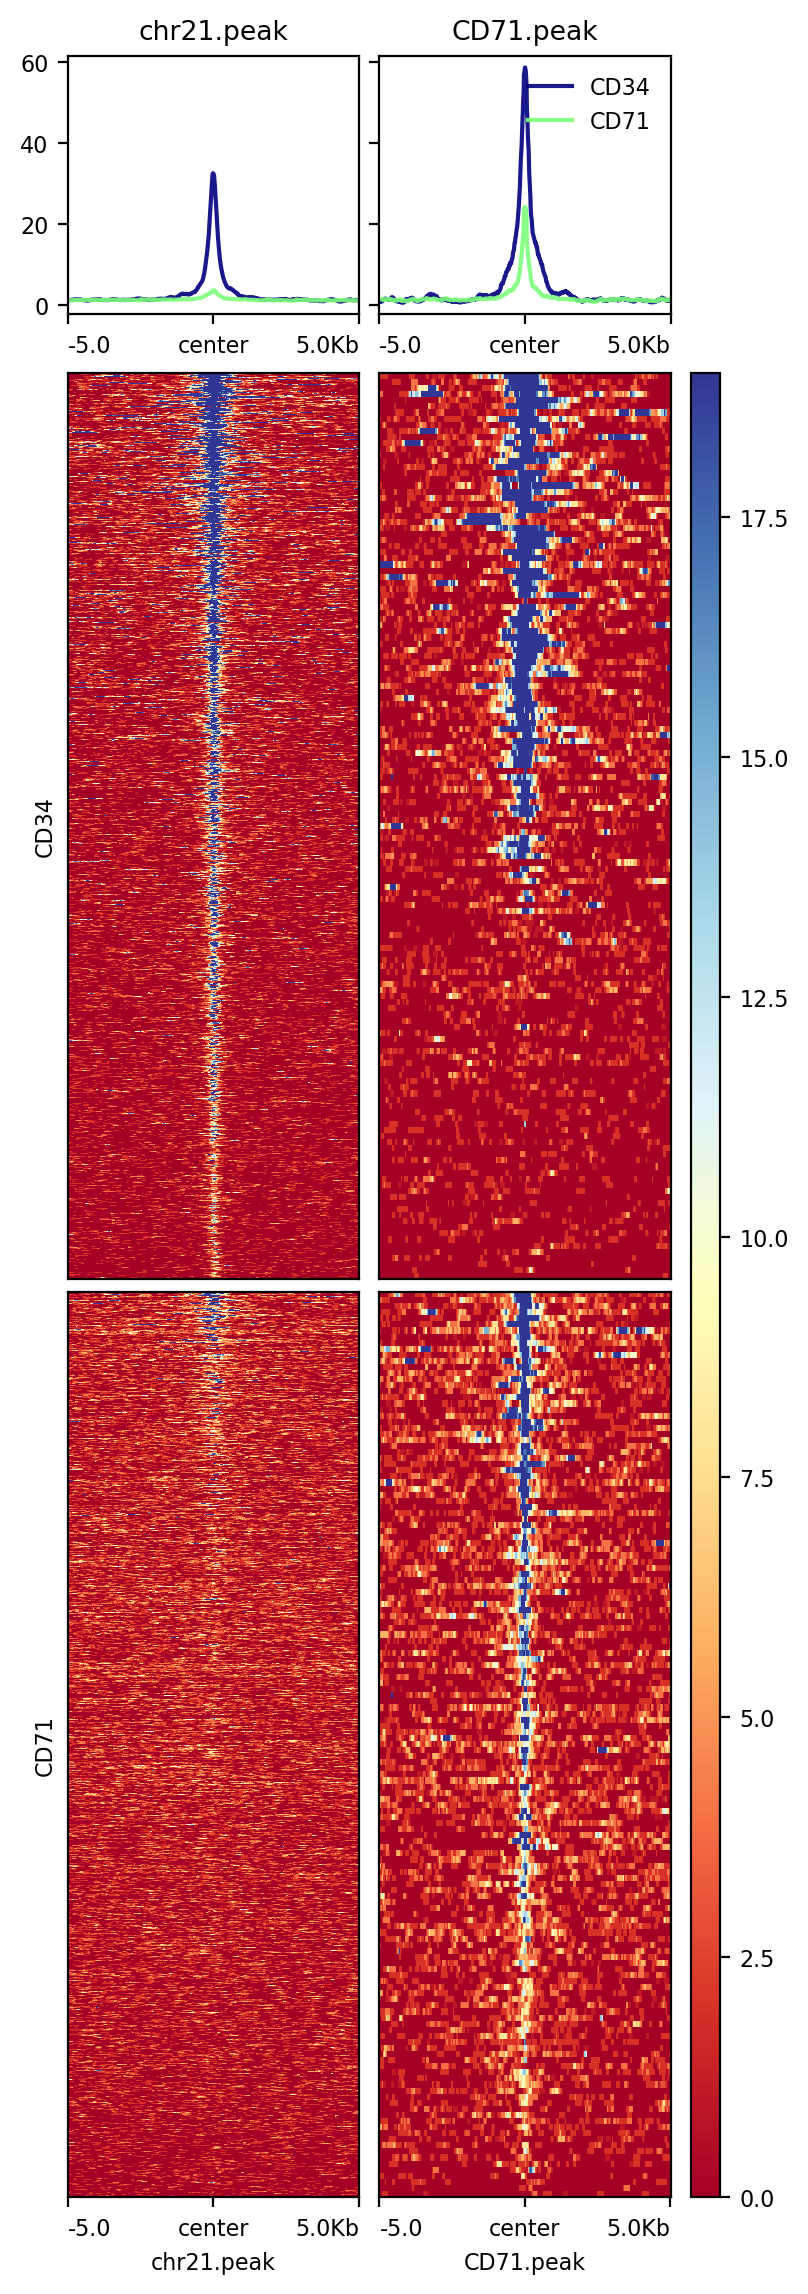
[102]:
!plotHeatmap -m test2.gz -out test2.png --perGroup
Image("test2.png")
[102]:
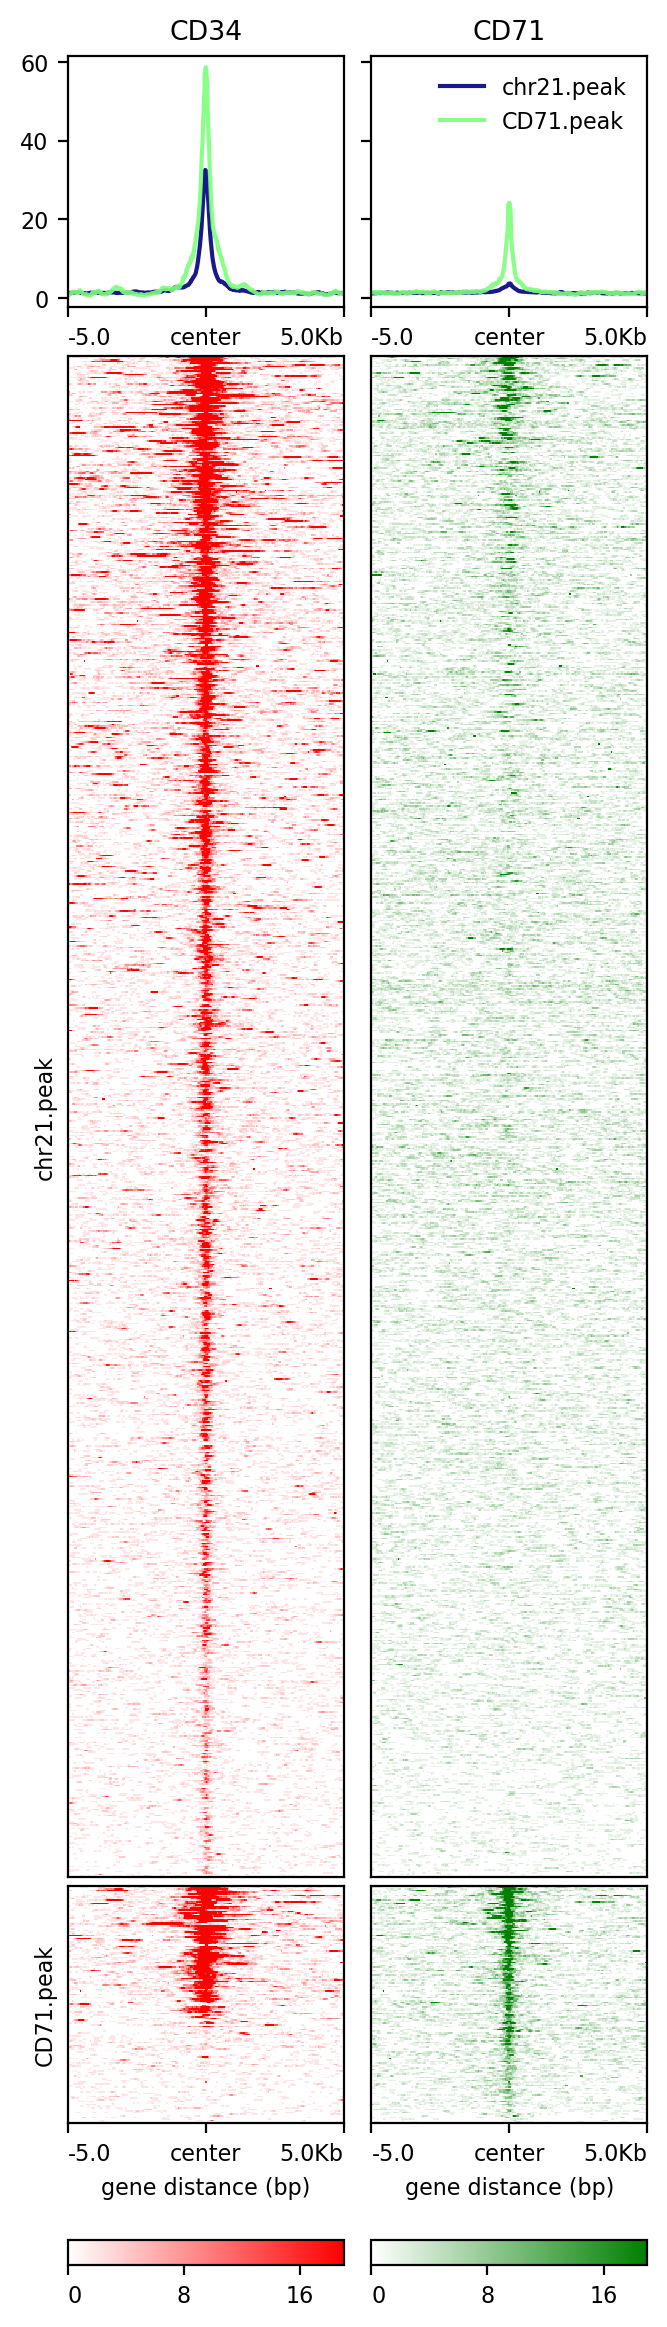
[104]:
!plotHeatmap -m test2.gz -out test2.png --colorList white,red white,green
Image("test2.png")
[104]:
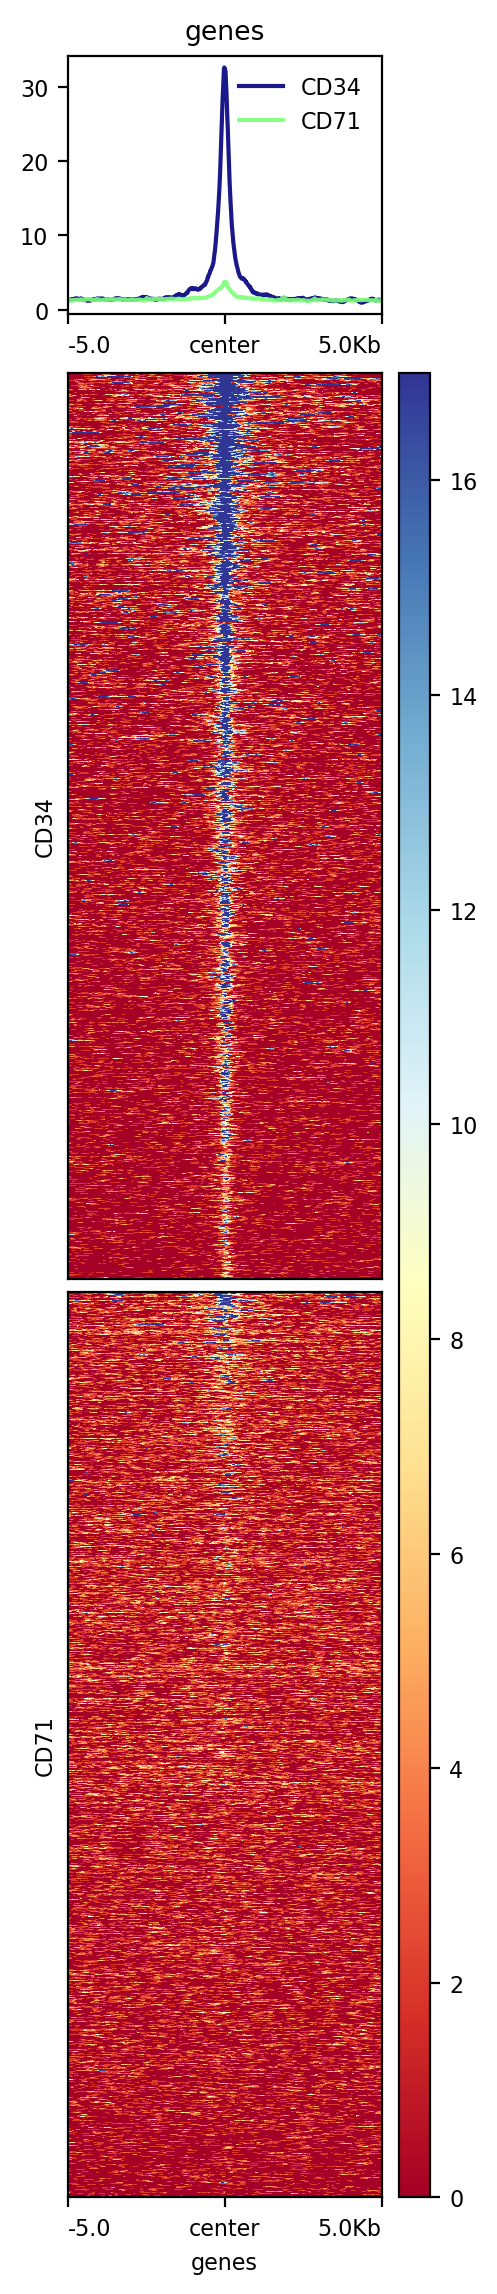
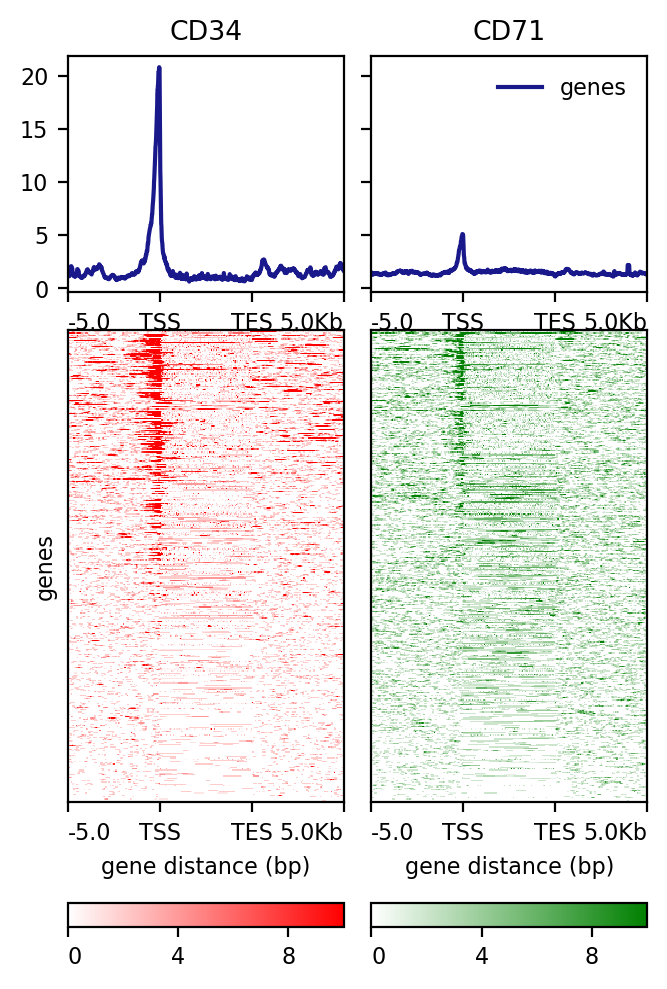
[105]:
!computeMatrix scale-regions \
-a 5000 -b 5000 -m 5000 \
-R hg19.chr21.gene.bed \
-S CD34.bw CD71.bw \
--skipZeros \
-p 20 \
-o test3.gz
Skipping ENSG00000269011, due to being absent in the computeMatrix output.
Skipping ENSG00000227874, due to being absent in the computeMatrix output.
Skipping ENSG00000214319, due to being absent in the computeMatrix output.
Skipping ENSG00000232797, due to being absent in the computeMatrix output.
[109]:
!plotHeatmap -m test3.gz -out test3.png \
--colorList white,red white,green \
--heatmapHeight 8
Image("test3.png")
[109]:
signal plot summary
two-steps, first to computeMatrix (two modes), then plotHeatmap
plotHeatmap can’t control line plot color. To do so, use plotProfile, but it can’t plot the heatmap.
when making footprint plot, use binSize of 1bp or 2bp
default plot is per bed file, use
--perGroupto change it per bw file
[ ]:
[ ]:
[ ]: