(Notes) single-cell RNA-seq analysis
Data to explore 5/17/2024
pathway/ differential pathway/ regulon score/ hub gene score
https://jackbibby1.github.io/SCPA/
https://github.com/satijalab/seurat/issues/7492
https://bookdown.org/ytliu13207/SingleCellMultiOmicsDataAnalysis/scenic-differential-regulons.html
https://github.com/aertslab/SCENIC
https://morris-lab.github.io/CellOracle.documentation/tutorials/index.html https://morris-lab.github.io/CellOracle.documentation/installation/index.html
Intron reads are used by default in cellranger v7
20%-40% reads could come from intron (mainly due to internal poly-A priming). Previous version, those reads were not counted toward gene expression.
Markers
http://biocc.hrbmu.edu.cn/CellMarker/search.jsp?quickSearchInfo=mouse%20blood
http://static.bdbiosciences.com/documents/cd_marker_handbook.pdf
proliferation marker: PLK1,MYBL2,BUB1 https://www.nature.com/articles/nrc1802
Public scRNA_seq data (Mouse)
Two formats in R:
SingleCellExperiment
Seurat
https://satijalab.org/seurat/articles/conversion_vignette.html
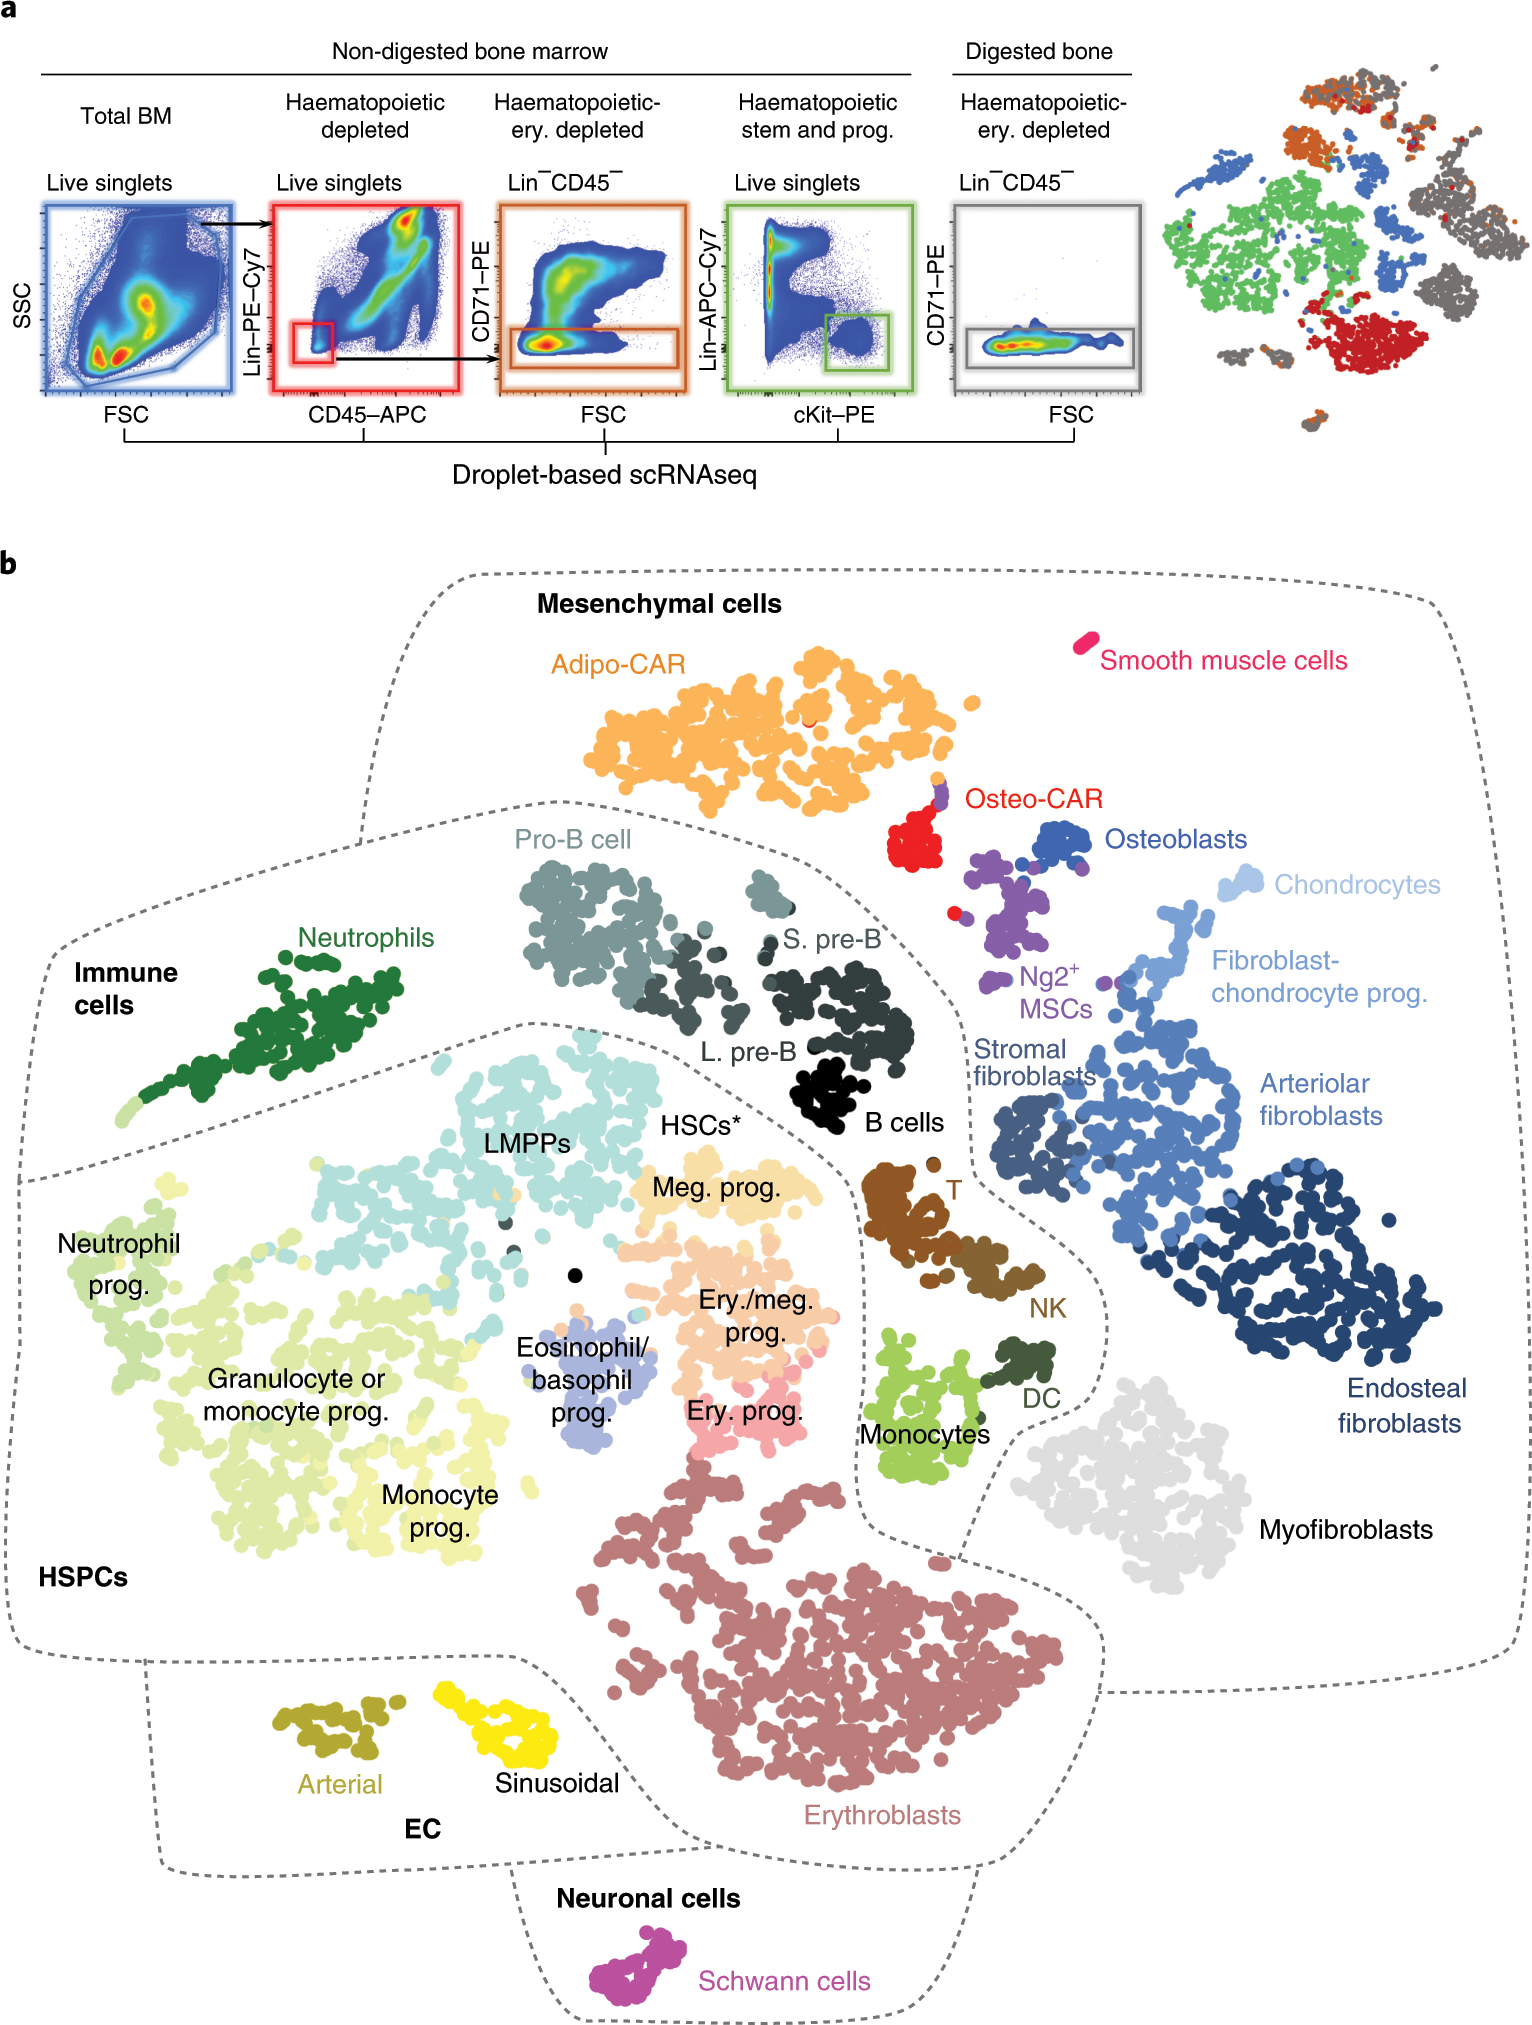
Baccin, C., Al-Sabah, J., Velten, L. et al. Combined single-cell and spatial transcriptomics reveal the molecular, cellular and spatial bone marrow niche organization. Nat Cell Biol 22, 38–48 (2020).
https://nicheview.shiny.embl.de/
Nestorowa, S. et al. A single-cell resolution map of mouse hematopoietic stem and progenitor cell differentiation. Blood 128, e20–31 (2016)
https://hemberg-lab.github.io/scRNA.seq.datasets/
http://blood.stemcells.cam.ac.uk/single_cell_atlas.html
RNA velocity
Make sure we have most recent samtools version, otherwise we will see “cellsorted file not found” error.
module load conda3/202011

source activate captureC

module load samtools/1.9

bsub -P scRNA -J mNFIXko -R 'rusage[mem=50000]' velocyto run10x mNFIXko $gtf
Annotate cell clusters
scCATCH, not sure if it supports de novo clusters
given a reference Seurat obj, project all other data to this reference, this method support de novo clusters!
TODO need reference Seurat obj
projection
This is quite simple that
https://www.nature.com/articles/nmeth.4644.pdf
we carried out a form of k-nearest -neighbor classification with only cosine similarity. >0.5. three nearest neighbors
For the number of features, we used the top 100, 200, 500, 1,000, 2,000, 5,000, or all genes. We calculated similarities by using the cosine similarity and Pearson and Spearman correlations, which are restricted to the interval [−1, 1] and are thus insensitive to differences in scale between data sets. We required that at least two of the similarities be in agreement, and that at least one be >0.7. If these criteria were not met, then c was labeled as “unassigned” to indicate that it did not correspond to any cell type present in the reference. For the approximate nearest neighbor search, which we refer to as scmap-cell, we carried out a form of k-nearest -neighbor classification with only cosine similarity. For a cell type to be assigned, we required that the three nearest neighbors have the same cell type and that the highest similarity among them be >0.5.
A list of python repos
QC
https://github.com/parklab/PaSDqc
Data cleaning
https://github.com/theislab/dca
differential analysis
https://github.com/theislab/diffxpy
trajectory
https://github.com/theislab/scvelo
Integration
https://github.com/mukamel-lab/SingleCellFusion
not sure
https://github.com/lingxuez/URSM
Seurat installation
- ::
conda create -n single_cell conda activate single_cell conda install -c bioconda r-seurat conda install -c anaconda libopenblas
Another installation: https://github.com/satijalab/seurat/issues/1619
Seurat does not return batch-corrected expression values (if we did, we would not be able to compare expression values over different conditions, as these would be subtracted).
https://github.com/satijalab/seurat/issues/283
get batch corrected gene distance
Velocity analysis
This is different than trajectory or pseudotime analysis.
Python
https://github.com/basilkhuder/Seurat-to-RNA-Velocity
velocyto is a good python package for this analysis. I used it to generate the loom file, however, simply reading this loom file doesn’t seem have enough meta info. This link should work for generating the meta info. But I proceeded to R.
R
https://github.com/satijalab/seurat-wrappers/blob/master/docs/velocity.md
http://pklab.med.harvard.edu/velocyto/notebooks/R/SCG71.nb.html
Data imputation
https://academic.oup.com/nar/article/50/9/4877/6582166
The results showed that DCA and DeepImpute outperformed other methods.
https://www.nature.com/articles/s41598-022-06500-4.pdf, this sciSR tool is the latest one. Not mentioned in the above review paper but they did compare sciSR to MAGIC and they have similar performance, however, in the test above, MAGIC doesn’t seem to perform well on simulated data.
https://github.com/theislab/dca
Step1, save matrix raw count:
write.table(as.matrix(merged_obj@assays$RNA@counts),
            'counts.csv',
            sep = ',', row.names = T, col.names = T, quote = F)
module load conda3/202011

source activate captureC

dca counts.csv DCA_results
pseudo time inference
https://www.nature.com/articles/s41587-019-0071-9
this review paper suggests slingshot