Interactive heatmap
usage: interactive_heatmap.py [-h] -f INPUT -o OUTPUT [--reformat_config REFORMAT_CONFIG] [--header] [--index] [--sep SEP]

optional arguments:
  -h, --help            show this help message and exit
  -f INPUT, --input INPUT
                        data table to be plot (default: None)
  -o OUTPUT, --output OUTPUT
                        output visualization html file (default: None)
  --reformat_config REFORMAT_CONFIG
                        reformat data table (default: None)
  --header              data table has header (default: False)
  --index               data table has index (default: False)
  --sep SEP             data table separator (default: auto)
Example
Input
Data table, csv or tsv, auto determined. If data table contains both row names and column names, use --index --header
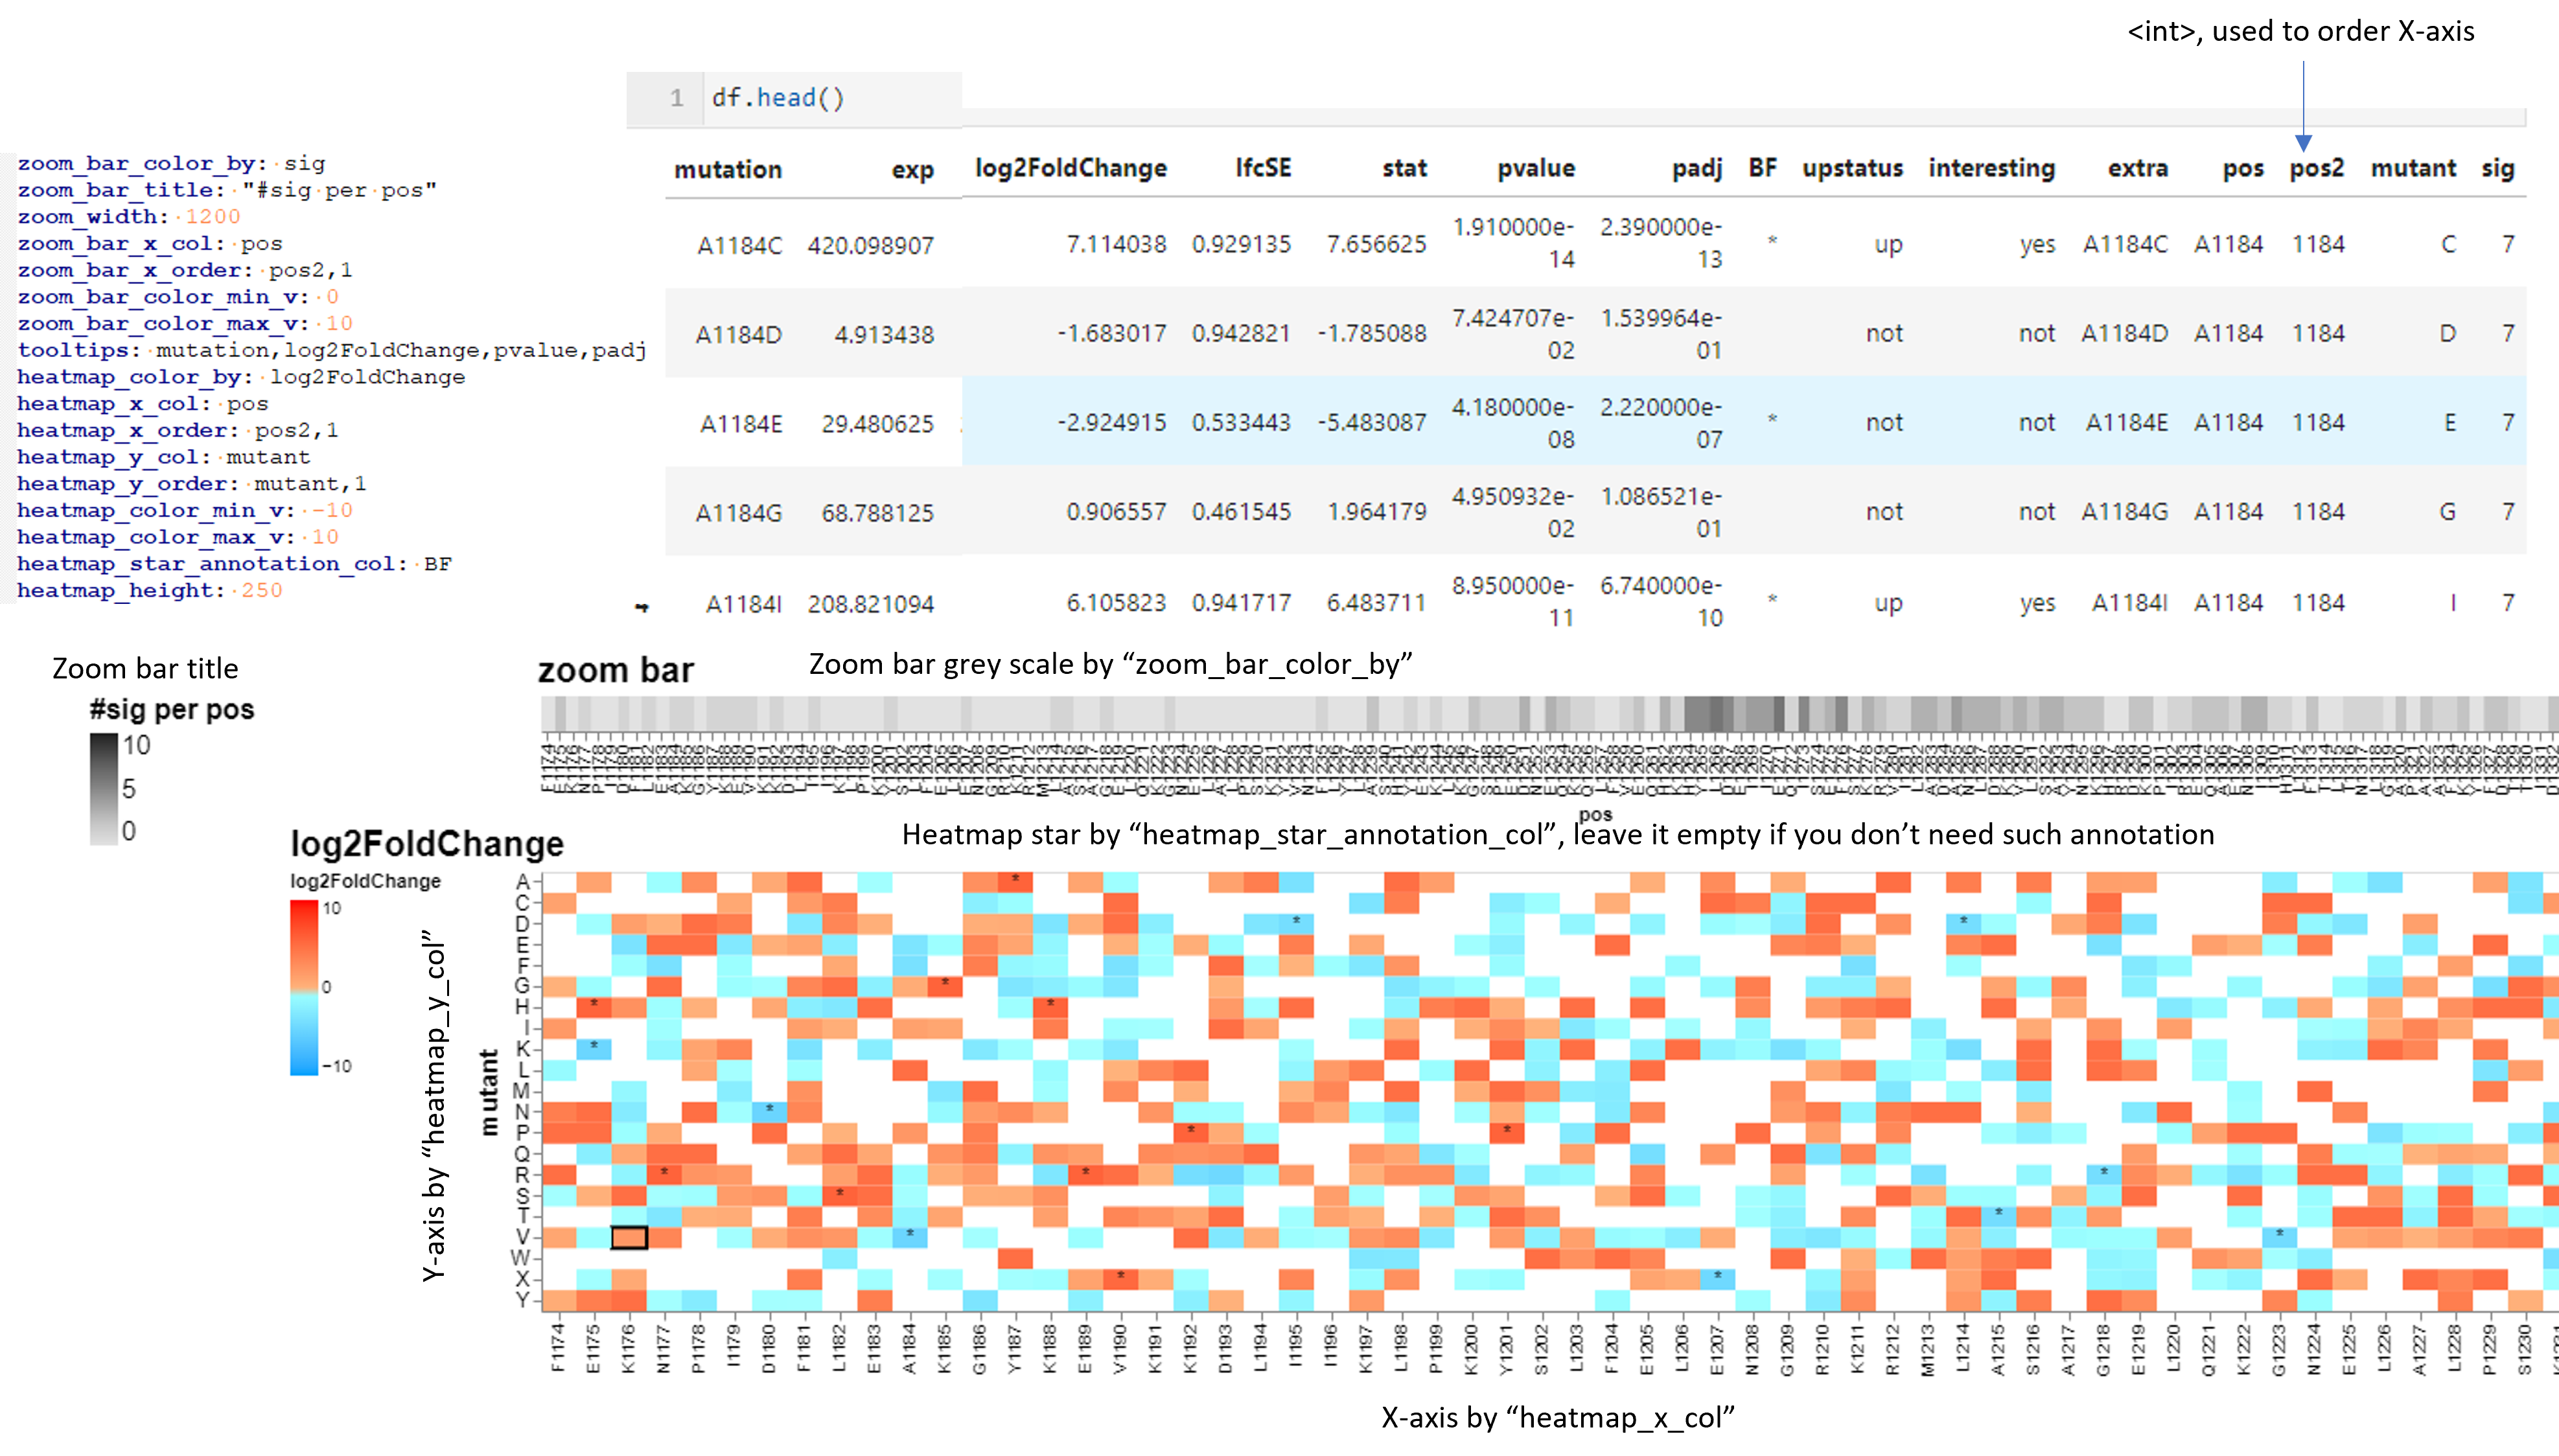
Plot configuration file. Example:
zoom_bar_color_by: sig
zoom_bar_title: "#sig per pos"
zoom_width: 1200
zoom_bar_x_col: pos
zoom_bar_x_order: pos2,1
zoom_bar_color_min_v: 0
zoom_bar_color_max_v: 10
tooltips: mutation,log2FoldChange,pvalue,padj
heatmap_color_by: log2FoldChange
heatmap_x_col: pos
heatmap_x_order: pos2,1
heatmap_y_col: mutant
heatmap_y_order: mutant,1
heatmap_color_min_v: -10
heatmap_color_max_v: 10
heatmap_star_annotation_col: BF
heatmap_height: 250
A preset config is provided for the mutagenesis data: --reformat_config kasey
Usage
hpcf_interactive -q standard -R "rusage[mem=20000]"

module load conda3/202011

source activate /home/yli11/.conda/envs/captureC

# cd to your data dir

interactive_heatmap.py -f input.txt --reformat_config kasey --header -o test.html
Comments
code @ github.