Plot text on bar plot
Summary
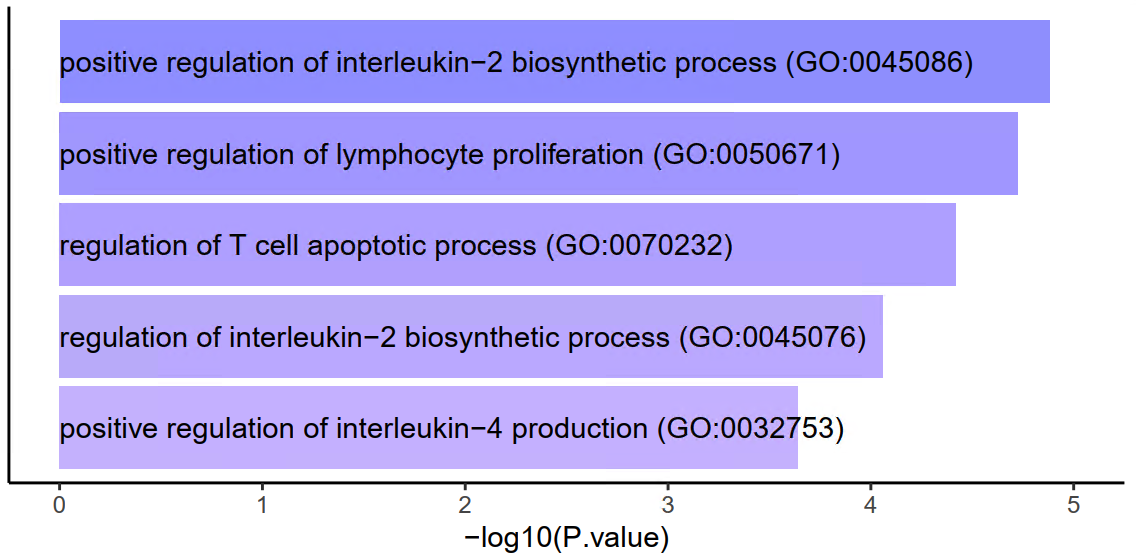
Designed for GO enrichment barplot. Putting the text on the bar to save space.
Input
Two columns with name Term and P.value are required. You can also change these names in the R code below.
[yli11@nodecn125 GO]$ head test.tsv
Term    P-value
positive regulation of interleukin-2 biosynthetic process (GO:0045086)  1.3152559616433014E-5
positive regulation of lymphocyte proliferation (GO:0050671)    1.8853440096000123E-5
R code
hpcf_interactive

module load R/3.5.1
The following R code only plots the top 5 terms. Use scale_fill_gradient2(low = "black",high="blue") to control color.
library(EnhancedVolcano)
library(ggrepel)
library(dplyr)

df = read.csv("test.tsv",sep="\t") ### input file
orderBy="P.value"
idx <- order(df[[orderBy]], decreasing = F)
df$label <- factor(df$Term,levels=rev(unique(df$Term[idx])))
df = head(df,n=5)

p=ggplot(data=head(df),aes(x=label,y=-log10(P.value),fill=-log10(P.value)))+geom_bar(stat="identity", position=position_identity(),alpha=0.4)+coord_flip() +scale_fill_gradient2(low = "black",high="blue")+ylim(c(0, 5))+guides(fill=FALSE)+
geom_text(aes(x=label,y=rep(0,nrow(df)),label=label),hjust=0,inherit.aes=F)+
  theme(axis.title.y=element_blank(),
        axis.text.y=element_blank(),
        axis.ticks.y=element_blank())+
                theme(panel.grid.major = element_blank(), panel.grid.minor = element_blank(),
panel.background = element_blank(), axis.line = element_line(colour = "black"))
ggsave("test.pdf",heigh=3,width=6)