Statistical test on 2 signals
usage: signal_test.py [-h] --bw_file FILE [FILE ...] --bed_file FILE
                      [FILE ...] [--set_style SET_STYLE] [--log2]
                      [--extend EXTEND] [-o OUTPUT]

optional arguments:
  -h, --help            show this help message and exit
  --bw_file FILE [FILE ...]
                        input 1 or 2 bw files (default: None)
  --bed_file FILE [FILE ...]
                        input 1 or 2 bed files (default: None)
  --set_style SET_STYLE
                        searborn figure style, default is whitegrid, which is
                        used by ggplot2. You can also use white (default:
                        whitegrid)
  --log2                log2 transform raw values (default: False)
  --extend EXTEND       extend left and right, bed file (default: 0)
  -o OUTPUT, --output OUTPUT
                        output prefix (default:
                        signal_test_plot_yli11_2020-04-01)
Summary
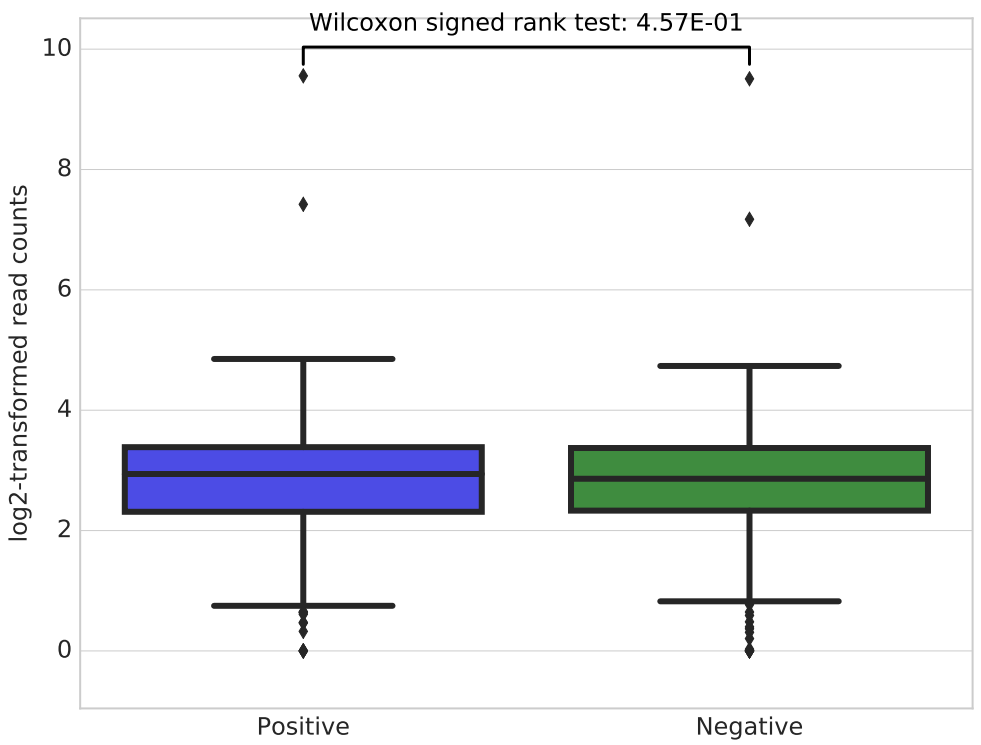
This program performs Wilcoxon test or Mann-Whitney test on two lists.
Input
For Wilcoxon test
Given 2 bigwig files and 1 bed file, we perform a paired-test to check if the signals from the two bw files coming from the same distribution.
For Mann-Whitney test
Given 1 bigwig files and 2 bed file, we test if the signals drawing from the same bw have any differences.
Usage
hpcf_interactive.sh

module load python/2.7.13

module load ucsc/041619

signal_test.py --bw_file input1.bw input2.bigwig --bed_file test1.bed --log2
OR:
signal_test.py --bw_file test1.bw --bed_file input1.bed input2.narrowPeak --log2
By default, figure style is whitegrid (see example below), you can also remove the grids by using --set_style white.
Output
Comments
code @ github.