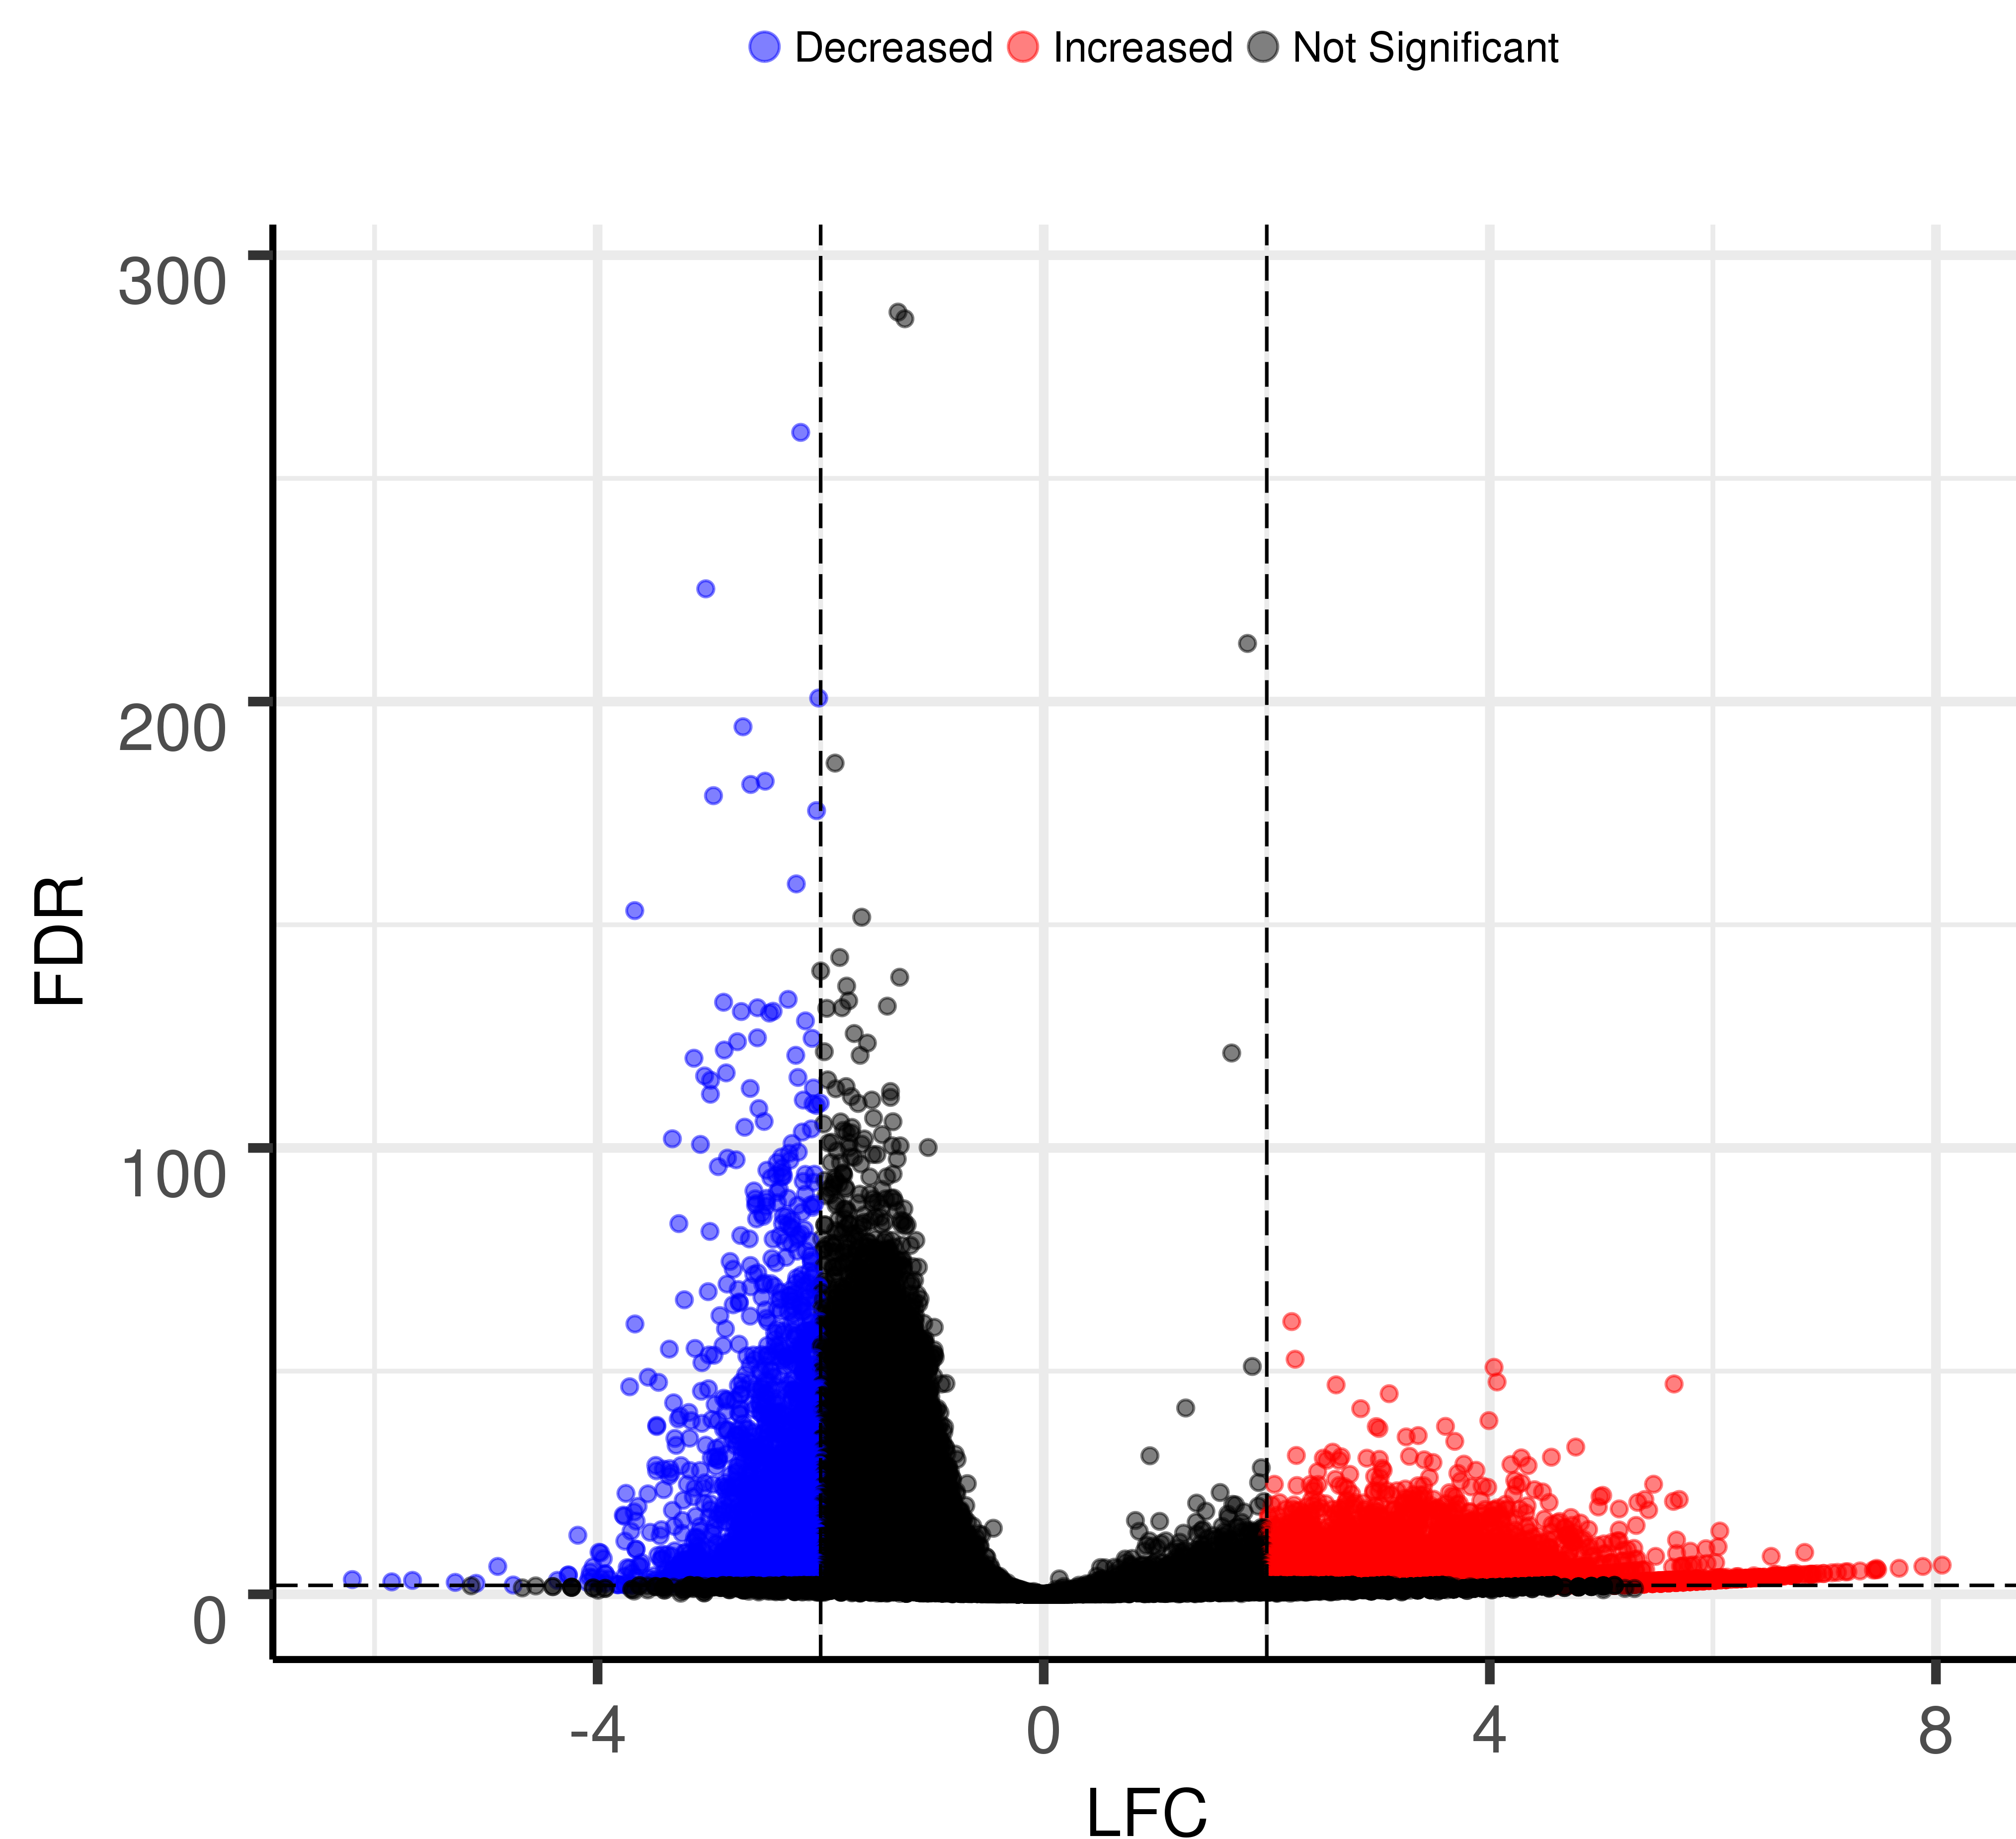
Volcano plot for logFC and P-value/FDR
usage: HemTools volcano_plot [-h] [--short] [--no_email] -f INPUT [-j JID]
                             [-s SEPERATOR] [--LFC_column LFC_COLUMN]
                             [--LFC_cutoff LFC_CUTOFF]
                             [--LFC_axis_name LFC_AXIS_NAME]
                             [--FDR_column FDR_COLUMN]
                             [--FDR_cutoff FDR_CUTOFF]
                             [--FDR_axis_name FDR_AXIS_NAME] [--title TITLE]
                             [--do_not_submit] [--output_figure OUTPUT_FIGURE]
Named Arguments
- --short
Force to use the short queue, don’t use it for volcano_plot
Default:
False- --no_email
Not for end-user
Default:
False- -f, --input
data table to be plot
- -j, --jid
enter a job ID, which is used to make a new directory. Every output will be moved into this folder.
Default:
'{{subcmd}}_docs_2026-07-17'
Named Arguments
- -s, --seperator
column seperator, comma(,), space(” “), or tab( )
Default:
','- --LFC_column
column name for log fold change
Default:
'LFC'- --LFC_cutoff
log fold change cutoff
Default:
'2'- --LFC_axis_name
The axis name for log fold change
Default:
'LFC'- --FDR_column
column name for p-value or FDR
Default:
'FDR'- --FDR_cutoff
p-value or FDR cutoff
Default:
'0.01'- --FDR_axis_name
The axis name for p-value or FDR
Default:
'FDR'- --title
Figure title
Default:
'Volcano plot'- --do_not_submit
EnhancedVolcano is installed on rhel7 nodes, by default you are on rhel6 nodes, unless you did
hpcf_interactive -q standard, please don’t use this option.Default:
False- --output_figure
output file name
Default:
'Volcano_plot_docs_2026-07-17.png'
Input file
INPUT: data table (-f option, required).
This is a data table, could be csv (default) or tsv. Seperator is provided by user. Basically, two columns (provided by user) will be used to make volcano plot.
Usage
    hpcf_interactive

    module load python/2.7.13

    ## for differential peaks

HemTools volcano_plot -f diffPeaks_output.txt -s "\t" --LFC_column logFC --FDR_column adj.P.Val

## for diffGene pipeline output

HemTools volcano_plot -f H2_vs_H1.gene.final.combined.tpm.csv -s , --LFC_column logFC --FDR_column qval
Note
Once the figure is made, it will be emailed to you.
Report bug
Once the job is finished, you will be notified by email with some attachments. If no attachment can be found, it might be caused by an error. In such case, please go to the result directory (where the log_files folder is located) and type:
HemTools report_bug
R code
If you are not satisfied with the figure (figsize, dpi, point size, etc), here’s the source code for you to customize your figure.
 1library(EnhancedVolcano)
 2
 3
 4args <- commandArgs(trailingOnly = TRUE)
 5
 6input_table = args[1]
 7seperator = args[2]
 8LFC_column = args[3]
 9LFC_cutoff = as.numeric(args[4])
10LFC_axis_name = args[5]
11FDR_column = args[6]
12FDR_cutoff = as.numeric(args[7])
13FDR_axis_name = args[8]
14Title = args[9]
15output_figure = args[10]
16
17if (seperator == "\\t"){
18    res <- read.csv(input_table, header=TRUE,sep="\t")
19}else{
20    res <- read.csv(input_table, header=TRUE,sep=seperator)
21}
22
23print (head(res))
24rownames(res) = res[,1]
25keyvals <- rep('black', nrow(res))
26
27names(keyvals) <- rep('Not Significant', nrow(res))
28
29
30keyvals[which(res[LFC_column] > LFC_cutoff & res[FDR_column] < FDR_cutoff)] <- 'red'
31names(keyvals)[which(res[LFC_column] > LFC_cutoff & res[FDR_column] < FDR_cutoff)] <- 'Increased'
32
33
34keyvals[which(res[LFC_column] < -LFC_cutoff & res[FDR_column] < FDR_cutoff)] <- 'blue'
35names(keyvals)[which(res[LFC_column] < -LFC_cutoff & res[FDR_column] < FDR_cutoff)] <- 'Decreased'
36
37f <- function(y) seq(floor(min(y)), ceiling(max(y)))
38EnhancedVolcano(res,
39    lab = rownames(res),
40    selectLab =c(""),
41    x = LFC_column,
42    y = FDR_column,
43    xlab = LFC_axis_name,
44    ylab = FDR_axis_name,
45    title = Title,
46    colOverride = keyvals,
47    colConnectors = 'grey50',
48    pCutoff = FDR_cutoff,
49    FCcutoff = LFC_cutoff,
50    transcriptPointSize = 3,
51    transcriptLabSize = 3.0)+ scale_y_continuous(breaks = f)+ scale_x_continuous(breaks = f)
52
53ggsave(output_figure,dpi=600,device ="pdf")
54dev.off()
55EnhancedVolcano(res,
56    lab = rownames(res),
57    selectLab =rownames(res)[which(names(keyvals) %in% c("Increased","Decreased"))][1:10],
58    x = LFC_column,
59    y = FDR_column,
60    xlab = LFC_axis_name,
61    ylab = FDR_axis_name,
62    title = Title,
63    colOverride = keyvals,
64    colConnectors = 'grey50',
65    pCutoff = FDR_cutoff,
66    FCcutoff = LFC_cutoff,
67    transcriptPointSize = 3,
68    transcriptLabSize = 3.0)+ scale_y_continuous(breaks = f)+ scale_x_continuous(breaks = f)
69
70ggsave(paste(output_figure,".withNames.pdf",sep=""),dpi=600,device ="pdf")
71dev.off()
Latest R code
library(EnhancedVolcano)


input_table = "20copy_vs_Jurkat.gene.final.combined.tpm.csv"
seperator = ","
LFC_column = "logFC"
LFC_cutoff = 2
LFC_axis_name = "LFC"
FDR_column = "qval"
FDR_cutoff = 0.01
FDR_axis_name = "-logFDR"
Title = "20copy vs Jurkat"
output_figure = "Volcano_plot_yli11_2020-12-03.pdf"

if (seperator == "\\t"){
  res <- read.csv(input_table, header=TRUE,sep="\t")
}else{
  res <- read.csv(input_table, header=TRUE,sep=seperator)
}

print (head(res))
rownames(res) = make.unique(as.character(res[,4]))
keyvals <- rep('black', nrow(res))

names(keyvals) <- rep('Not Significant', nrow(res))


keyvals[which(res[LFC_column] > LFC_cutoff & res[FDR_column] < FDR_cutoff)] <- 'red'
names(keyvals)[which(res[LFC_column] > LFC_cutoff & res[FDR_column] < FDR_cutoff)] <- 'Increased'


keyvals[which(res[LFC_column] < -LFC_cutoff & res[FDR_column] < FDR_cutoff)] <- 'blue'
names(keyvals)[which(res[LFC_column] < -LFC_cutoff & res[FDR_column] < FDR_cutoff)] <- 'Decreased'


sel_df = res[which((abs(res[LFC_column]) > LFC_cutoff)&(res[FDR_column] < FDR_cutoff)),]

sel_df[FDR_column] = -log10(sel_df[FDR_column])

f <- function(y) seq(floor(min(y)), ceiling(max(y)))
p=EnhancedVolcano(res,
    lab = rownames(res),
    # selectLab = c("Ets1","Nfix","Hmga2","Lpl","Il10ra","Cdkn2a","Irs2","Il1b","Socs3","Pdcd1","Mmp8","Il18","Ccnd1","Lgals3","Bcl2l11", "Ccl5","Gzmb","Bax","Mdm2","Chek2"),
    selectLab = c(""),
    # check_overlap = T,
    x = LFC_column,
    y = FDR_column,
  xlab = LFC_axis_name,
  ylab = FDR_axis_name,
    title = Title,
    colOverride = keyvals,
    colConnectors = 'grey50',
    pCutoff = FDR_cutoff,
    FCcutoff = LFC_cutoff,
    DrawConnectors = F,
    widthConnectors = 0.2,
    transcriptPointSize = 1,
    gridlines.major = TRUE, gridlines.minor = FALSE,
    transcriptLabSize = 3.0)+ scale_y_continuous(breaks = f)+ scale_x_continuous(breaks = f)+
  xlim(-10, 15)+
  ylim(0, 37)

pg <- ggplot_build(p)

sel_df['x'] = sel_df[LFC_column]
sel_df['y'] = sel_df[FDR_column]


p = p+geom_text_repel(data=sel_df[sel_df$x > 0,],aes(x=x,y=y,label=ext_gene),
point.padding = 0.2,
        segment.color="#878686",
        inherit.aes=F,
        nudge_x = 2,
    arrow = arrow(length = unit(0.015, "npc")),force=3)


p = p+geom_text_repel(data=sel_df[sel_df$x < 0,],aes(x=x,y=y,label=ext_gene),
point.padding = 0.2,
        segment.color="#878686",
        nudge_x = -2,
    arrow = arrow(length = unit(0.015, "npc")),force=3)


ggsave(output_figure,dpi=600,device ="pdf")