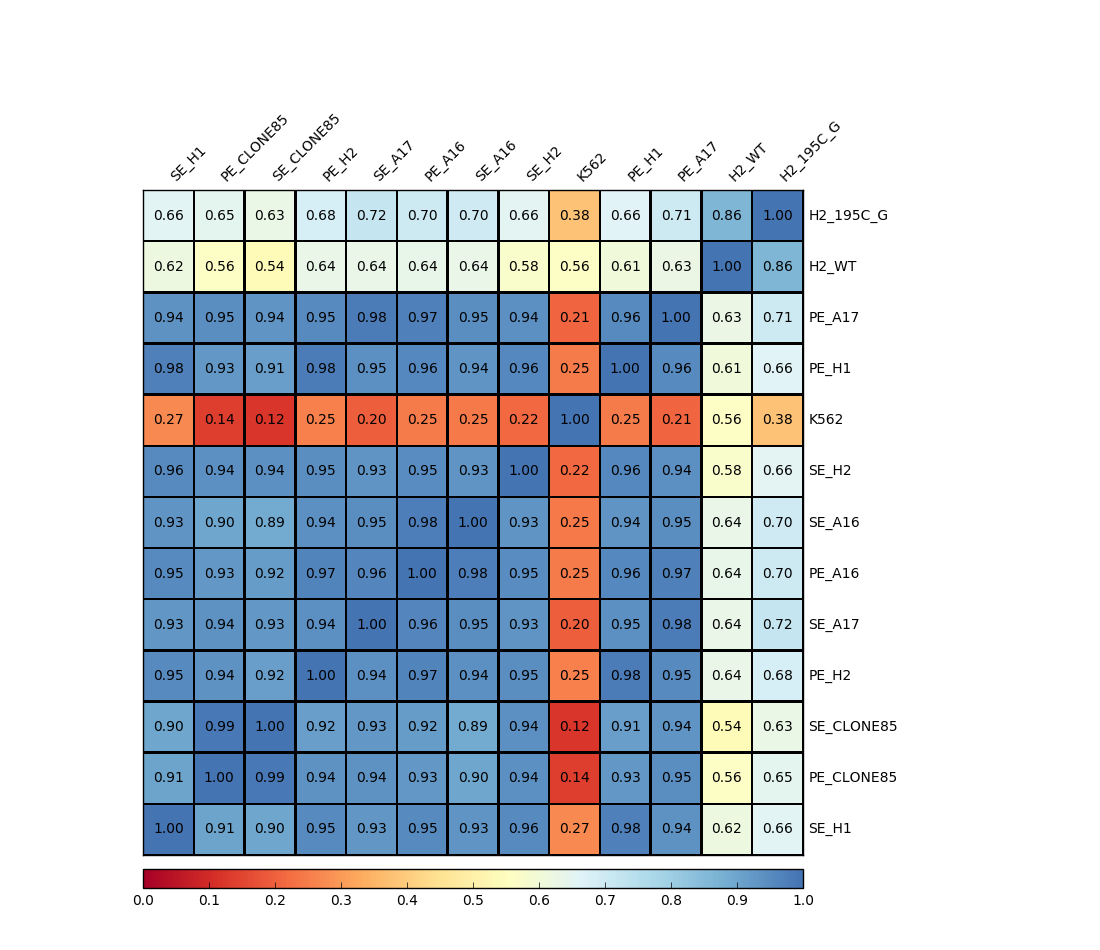
Re-order Correlation heatmap
usage: plot_corr_reorder.py [-h] -f INPUT -n REORDER_NAMES [-s SEP]
                            [--skiprows SKIPROWS] [-o OUTPUT]

optional arguments:
  -h, --help            show this help message and exit
  -f INPUT, --input INPUT
                        correlation matrix with index and header (default:
                        None)
  -n REORDER_NAMES, --reorder_names REORDER_NAMES
                        two columns showing old names and new names (default:
                        None)
  -s SEP, --sep SEP     this program can infer separator automatically, but it
                        may fail. Use auto if the input tables contain
                        different separators. (default: auto)
  --skiprows SKIPROWS   Pandas read_csv parameter to skip first N rows
                        (default: 0)
  -o OUTPUT, --output OUTPUT
                        output file name (default: yli11_2020-04-07)
Summary
Plot correlation heatmap given correlation matrix.
One usage: When using bw corr, the result figure can look bad because of large number of files (>50). In this case, you want to plot your own figures using their output.
This program allows you to rename and re-order columns and rows.
Note this program requires the matrix, which is plotCorrelation.tab and a name mapping file (old name and new name). Old names should match the column names in plotCorrelation.tab, which is the file names if you start with bw_corr.py.
Input
A correlation matrix with index name and column names.
A new names tsv file (e.g., row_name_mapping.txt), 2 columns: old name and new name
SE_H1.bw        SE_H1
PE_CLONE85.bw   PE_CLONE85
SE_CLONE85.bw   SE_CLONE85
PE_H2.bw        PE_H2
SE_A17.bw       SE_A17
PE_A16.bw       PE_A16
SE_A16.bw       SE_A16
SE_H2.bw        SE_H2
K562.bw K562
PE_H1.bw        PE_H1
PE_A17.bw       PE_A17
H2_WT.bw        H2_WT
H2_195C_G.bw    H2_195C_G
Output
Usage
Go to your data directory and type the following.
Step 0: Load python version 2.7.13.
hpcf_interactive

module load python/2.7.13

plot_corr_reorder.py -f plotCorrelation.tab --skiprows 1 -s "\t" -o test.png -n row_name_mapping.txt
plotCorrelation.tab is an output from bw corr, the first line is notes, so we skip the first row when read the file using --skiprows 1.