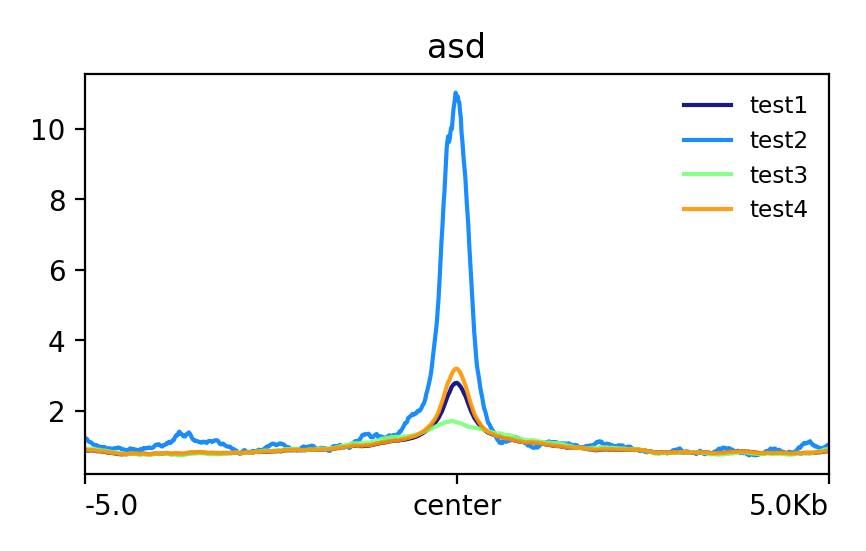
Average signal over multiple peaks
usage: signal_plot2.py [-h] [-j JID] [--current_dir] [-u U] [-d D]
                       [--bw_list BW_LIST] [--bed_list BED_LIST]

signal plot 2

optional arguments:
  -h, --help           show this help message and exit
  -j JID, --jid JID    enter a job ID, which is used to make a new directory.
                       Every output will be moved into this folder. (default:
                       signal_plot2_yli11_2020-02-04)
  --current_dir        plot all bw files and all bed files (default: False)
  -u U                 upstream flanking length (default: 5000)
  -d D                 downstream flanking length (default: 5000)
  --bw_list BW_LIST    bw_file_list (default: None)
  --bed_list BED_LIST  bed_list (default: None)
Summary
Put all your peak files and bw files in one folder and use this program to generate a plot for each bw file. This program will use all *.bw *.bed *Peak files in the current dir.
Example
Input
No input required. Just put all your files in a folder.
Output
You will receive each figure through email.
Usage
hpcf_interactive

module load python/2.7.13

signal_plot2.py --current_dir