Average signal for multiple bw over one bed
usage: signal_plot_bed.py [-h] [-j JID] [-u U] [-d D]
                          [--computeMatrix_addon_parameters COMPUTEMATRIX_ADDON_PARAMETERS]
                          [-c COLORS] --bw_files BW_FILES [BW_FILES ...] -f
                          BED

signal plot 2

optional arguments:
  -h, --help            show this help message and exit
  -j JID, --jid JID     enter a job ID, which is used to make a new directory.
                        Every output will be moved into this folder. (default:
                        signal_plot_bed_yli11_2020-11-13)
  -u U                  upstream flanking length (default: 5000)
  -d D                  downstream flanking length (default: 5000)
  --computeMatrix_addon_parameters COMPUTEMATRIX_ADDON_PARAMETERS
                        add user-defined parameters to computeMatrix (default:
                        )
  -c COLORS, --colors COLORS
                        colors, seperated by comma, hex color is OK (default:
                        red,green,blue,yellow,grey,purple,darkgreen,darkred,pi
                        nk,orange)
  --bw_files BW_FILES [BW_FILES ...]
                        bw_file_list (default: None)
  -f BED, --bed BED     one bed file (default: None)
  --plotProfile_addon_parameters PLOTPROFILE_ADDON_PARAMETERS
                        plotProfile_addon_parameters (default: )
Summary
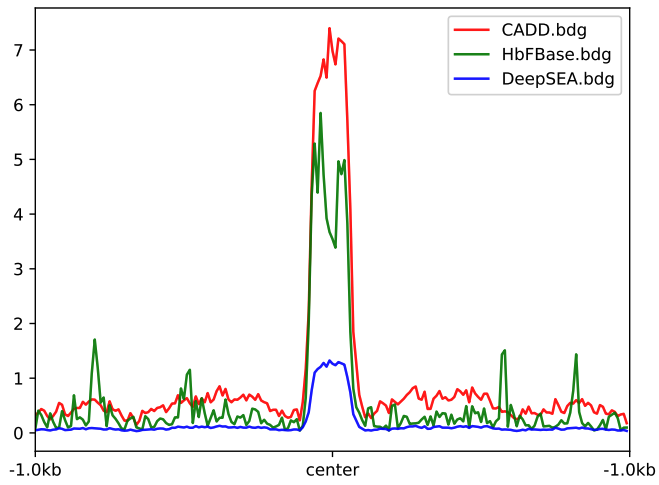
Given one bed file and multiple bw files, plot the average signal over the bed file. Users can assign colors.
Example
Input
Input bw file names, separated by space.
Output
You will receive the figure through email.
Usage
Copy your bw files and bed files and run the following for each bed file.
You can use Hex color code for colors, e.g., --colors #03fc24,#7522d4, separated by comma.
hpcf_interactive

module load python/2.7.13

signal_plot_bed.py -f loci.bed -u 1000 -d 1000 --bw_files CADD.bdg.bw HbFBase.bdg.bw DeepSEA.bdg.bw --colors red,green,blue
To fix Y-axis, use:
signal_plot_bed.py -f loci.bed -u 1000 -d 1000 --bw_files CADD.bdg.bw HbFBase.bdg.bw DeepSEA.bdg.bw --colors red,green,blue --plotProfile_addon_parameters " --yMin 0 --yMax 10"