plt.figure(figsize=(30,10))
WT_list = [x for x in df.columns if "WT" in x]
red_color = sns.color_palette("Reds")
blue_color = sns.color_palette("Blues")
red_count = 1
blue_count = 1
for c in WT_list:
if "After" in c:
plot_spectrum_single(df.index,df[c],c,red_color[red_count])
red_count+=1
else:
plot_spectrum_single(df.index,df[c],c,blue_color[blue_count])
blue_count+=1
plt.legend()
plt.xticks(df.index)
plt.xticks(rotation = 90) # Rotates X-Axis Ticks by 45-degrees
plt.title("xx")
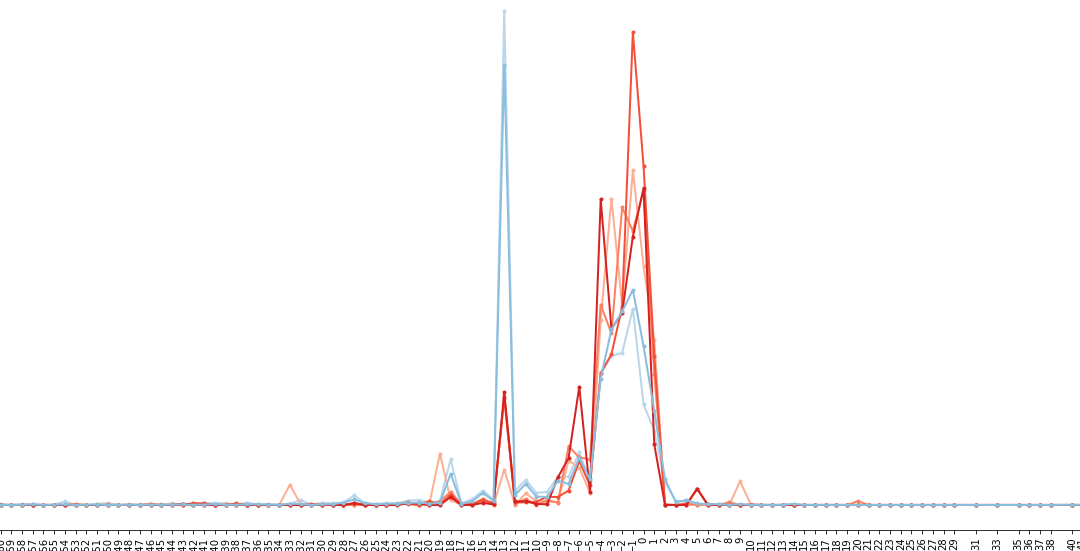
plt.xlabel("edit outcome")
plt.ylabel("indel frequency")
plt.savefig("xx.pdf",bbox_inches='tight')