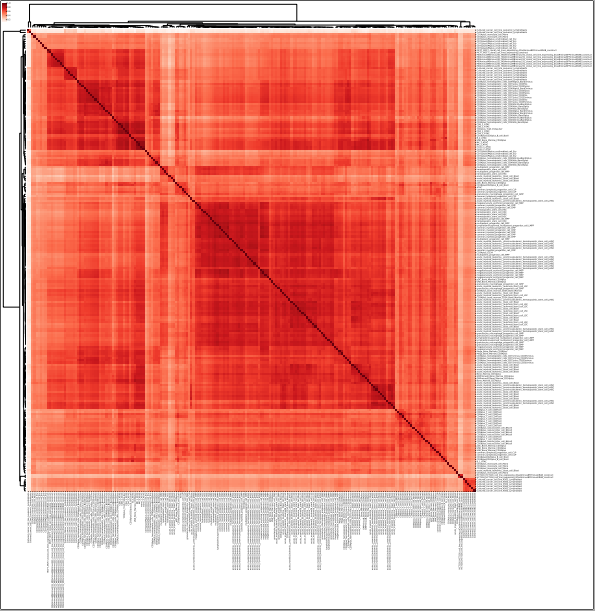
Correlation heatmap
usage: plot_corr.py [-h] -f INPUT [-s SEP] [--skiprows SKIPROWS] [--cmap CMAP]
                    [-o OUTPUT] [--size SIZE] [--smart_label]

optional arguments:
  -h, --help            show this help message and exit
  -f INPUT, --input INPUT
                        correlation matrix with index and header (default:
                        None)
  -s SEP, --sep SEP     this program can infer separator automatically, but it
                        may fail. Use auto if the input tables contain
                        different separators. (default: auto)
  --skiprows SKIPROWS   Pandas read_csv parameter to skip first N rows
                        (default: 0)
  --cmap CMAP           Pandas read_csv parameter to skip first N rows
                        (default: Reds)
  -o OUTPUT, --output OUTPUT
                        output file name (default: yli11_2019-10-21)
  --size SIZE           Figure size, default=Ncol/4 (default: auto)
  --smart_label         try to infer a meaning unique group name, string will
                        be splited by . - |, items that occur only once or
                        occur above 95% will be removed (default: False)
Summary
Plot correlation heatmap given correlation matrix.
One usage: When using bw corr, the result figure can look bad because of large number of files (>50). In this case, you want to plot your own figures using their output.
Input
A correlation matrix with index name and column names.
Output
Usage
Go to your data directory and type the following.
Step 0: Load python version 2.7.13.
hpcf_interactive

module load python/2.7.13

plot_corr.py -f plotCorrelation.tab --smart_label --skiprows 1 -s "\t"
plotCorrelation.tab is an output from bw corr, the first line is notes, so we skip the first row when read the file using --skiprows 1.