Plot motif position density on peaks
usage: plot_homer_motif_peak.py [-h] -f BED_FILE [-g GENOME]
                                [--flanking_size FLANKING_SIZE]
                                [--bin_size BIN_SIZE]

optional arguments:
  -h, --help            show this help message and exit
  -f BED_FILE, --bed_file BED_FILE
                        bed or peak file (default: None)

Genome Info:
  -g GENOME, --genome GENOME
                        genome version: hg19, mm10, mm9 (default: hg19)

Plot Info:
  --flanking_size FLANKING_SIZE
                        extend this size to left and right (default: 1000)
  --bin_size BIN_SIZE   bin size for plot density, use minimal 10 maximal 50,
                        motif size can affect the figure a little bit, if you
                        want to make the peak stronger, change this parameter
                        (default: 20)
Example
Usage
Suppose you have done homer motif discovery, then go to your motif discovery result folder, in this folder you should see two folders named homerResults and knownResults.
Step 0: Load python version 2.7.13.
module load python/2.7.13
module load homer
Step 1: Run
plot_homer_motif_peak.py -f peak_file.bed
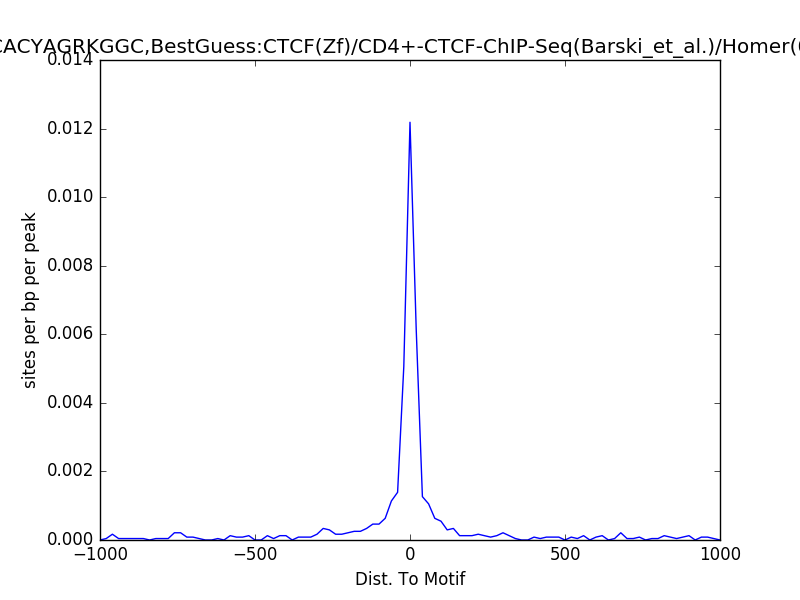
Output
The output folder is homer_all_motifs; it contains png files for every motif.
Comments
code @ github.