Table to heatmap, no clustering
usage: table2heatmap.py [-h] -f INPUT [-s SEP] [-o OUTPUT] [-W WIDTH]
                        [-H HEIGHT] [-c CMAP]

plot heatmap given a table, keep order.

optional arguments:
  -h, --help            show this help message and exit
  -f INPUT, --input INPUT
                        data table input, assume index and header (default:
                        None)
  -s SEP, --sep SEP     separator (default: None)
  -o OUTPUT, --output OUTPUT
                        output table name (default: yli11_2020-11-01.heatmap)
  -W WIDTH, --width WIDTH
                        Figure width, by default, w=N_row, if given, will
                        replace the default value (default: None)
  -H HEIGHT, --height HEIGHT
                        Figure height, by default, w=N_col, if given, will
                        replace the default value (default: None)
  -c CMAP, --cmap CMAP  python cmap (default: RdBu_r)
Input
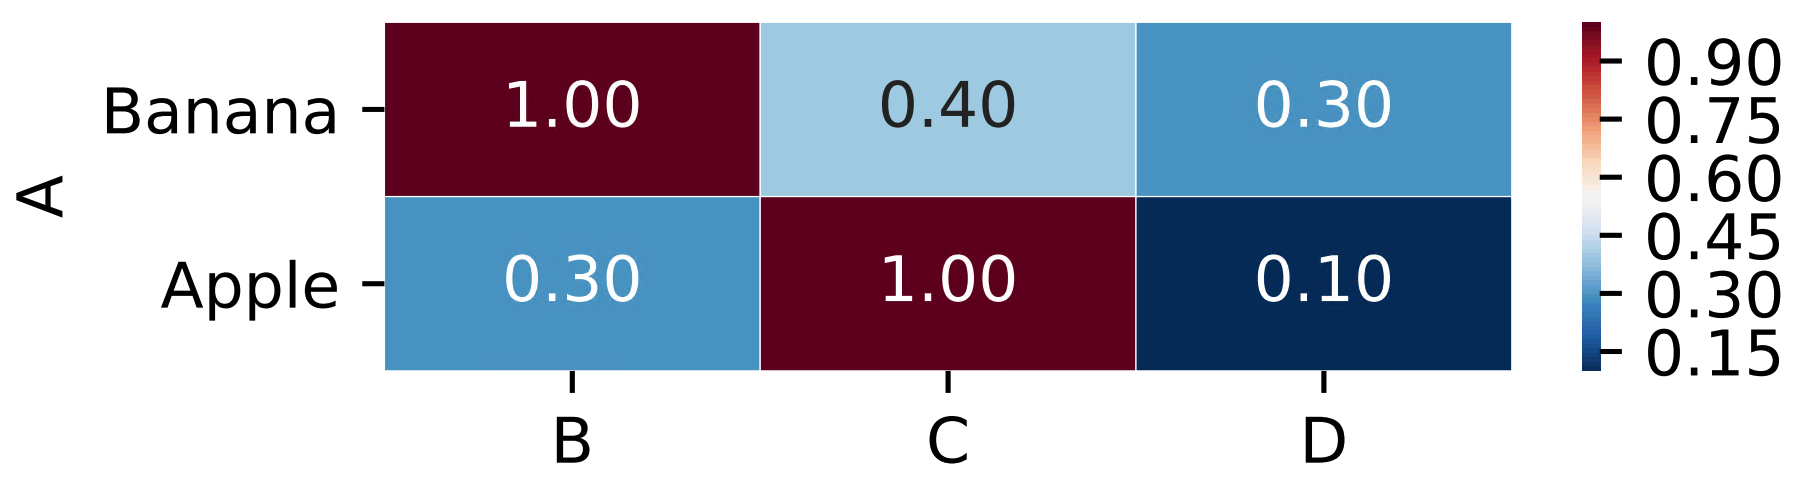
csv or tsv. The first column is row name, the first row is column name. Sep is infered by the program.
A,B,C,D
Banana,1,0.4,0.3
Apple,0.3,1,0.1
Output
Usage
PATH=/home/yli11/HemTools/bin:/hpcf/lsf/lsf_prod/10.1/linux3.10-glibc2.17-x86_64/etc:/hpcf/lsf/lsf_prod/10.1/linux3.10-glibc2.17-x86_64/bin:/usr/lpp/mmfs/bin:/usr/lpp/mmfs/lib:/usr/local/bin:/usr/bin:/usr/local/sbin:/usr/sbin:/opt/ibutils/bin:/sbin:/cm/local/apps/environment-modules/3.2.10/bin:/opt/puppetlabs/bin
echo $PATH
export PATH=$PATH:"/home/yli11/HemTools/bin"
hpcf_interactive.sh
module load conda3
source activate /home/yli11/.conda/envs/py2/


table2heatmap.py -f input.csv -W 4 -H 1 -o output.pdf
Use -W and -H to control figure size.