GSEA and pathway/GO enrichment analyses
run_GSEA.py [input_file] [logFC_cutoff] [pvalue_cutoff] [logFC_col_name] [pvalue_col_name] [out_file_label]
Summary
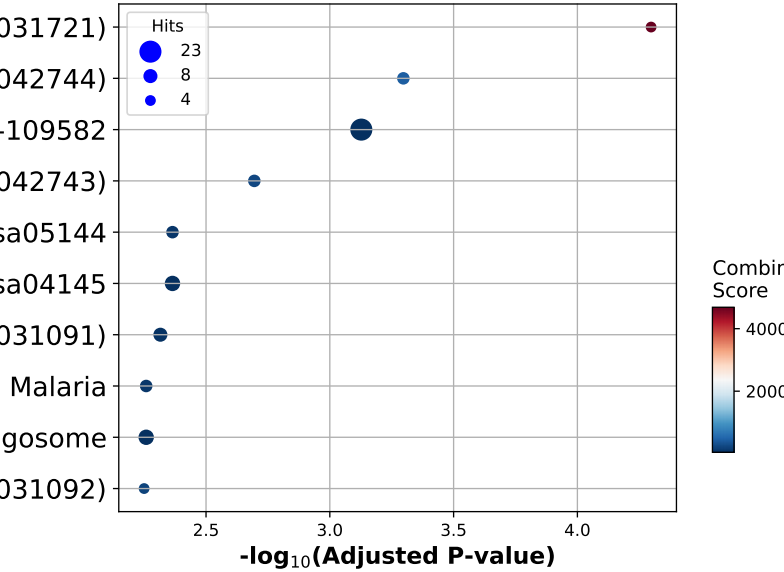
Given a differential gene expression table (a full table containing both significant and insignificant genes), this script performans Pathway and GO enrichment analysis (enrichR) for the follow databases:
GO_Biological_Process_2021
GO_Cellular_Component_2021
GO_Molecular_Function_2021
KEGG_2019_Mouse
KEGG_2021_Human
KEGG_2016
Reactome_2016
And the GSEA analysis (GSEApy) based on the MSIG database /home/yli11/Data/Human/MSigDB/msigdb.v7.5.1.symbols.gmt and the following databases:
KEGG_2019_Mouse
KEGG_2021_Human
KEGG_2016
Reactome_2016
Takes about 10-30 min to finish the whole analysis.
Input
The input can be a csv or a tsv file with the first column of gene names. The first row should be column names.
Usage
hpcf_interactive.sh

module load conda3/202011

source activate /home/yli11/.conda/envs/captureC

# suppose our input is from the diffgene pipeline, then we need to reformat the data

# example

cd /research_jude/rgs01_jude/groups/chenggrp/projects/blood_regulome/common/RNA/sorted/fetal_adult_expression/example/hg19_gene/d11_sleuth

awk -F "," '{print $4"\t"$13"\t"$3}' d11.gene.final.combined.tpm.csv > tmp.tsv

run_GSEA.py tmp.tsv 1 0.05 logFC qval example
Output
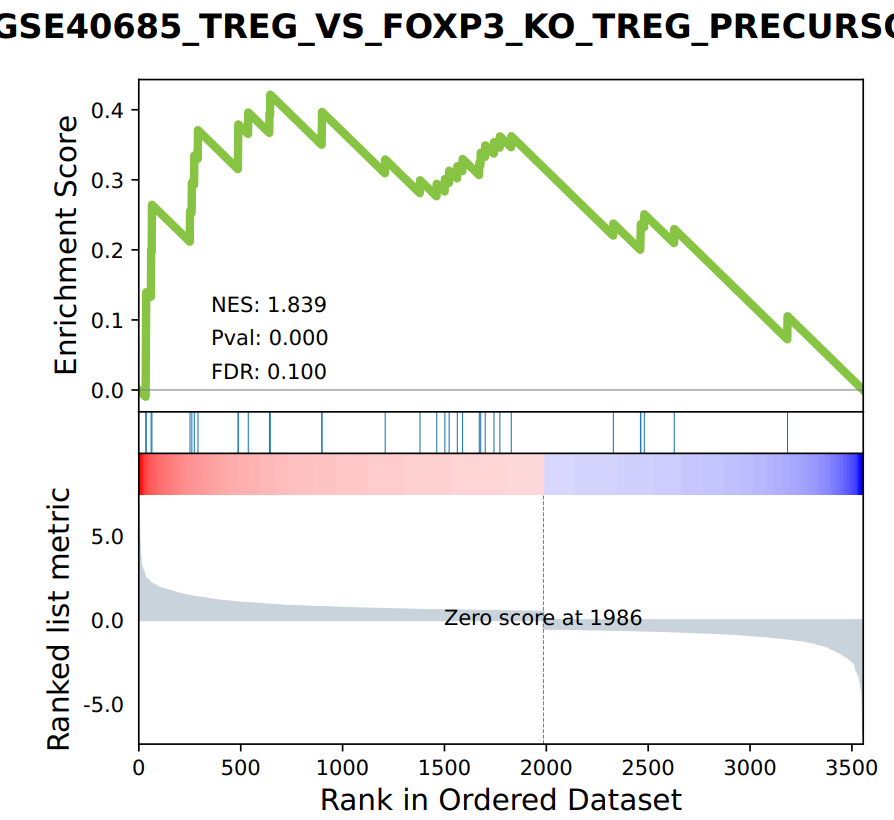
EnrichR results are in the Enrichr folder.
GSEA results are in the GSEA_Prerank and GSEA_plots_FDR_0.1 folder.
Example stats files are:
GSEA.MSigDB.stats.csv for GSEA results.
enrichR.stats.csv for enrichR results.
single-cell DEG table
Input
"p_val","avg_log2FC","pct.1","pct.2","p_val_adj","cluster","gene"
"Rps19",0.000968816245772386,-1.45422771177555,0.7,0.952,1,"Thymus-2d","Rps19"
"Rpl17",0.0015811263316563,-1.78520875573569,0.6,0.905,1,"Thymus-2d","Rpl17"
"Atp6v1e1",0.00161070110378718,1.79984655363141,0.8,0.19,1,"Thymus-2d","Atp6v1e1"
"Ms4a4b",0.00238694967180809,-2.0626041044794,0.2,0.714,1,"Thymus-2d","Ms4a4b"
"Fabp5",0.00261501850517121,3.62025552117883,0.4,0,1,"Thymus-2d","Fabp5"
"Rgl2",0.00261501850517121,0.55335218387991,0.4,0,1,"Thymus-2d","Rgl2"
"Slc39a14",0.00261501850517121,0.545149565178368,0.4,0,1,"Thymus-2d","Slc39a14"
Usage
hpcf_interactive.sh

module load conda3/202011

source activate /home/yli11/.conda/envs/captureC

run_GSEA_mouse.py Treg.time.DEG.csv outputFolder

run_GSEA_human.py Treg.time.DEG.csv outputFolder
Output
Output files are in ${outputFolder}_GSEA_(mouse/human)
Comments
code @ github.