Write flowchart using text
Step 1
hpcf_interactive -q standard -R "rusage[mem=4000]"
Step 2
module load conda3
source activate /home/yli11/.conda/envs/npm/
mmdc -h
Step 3
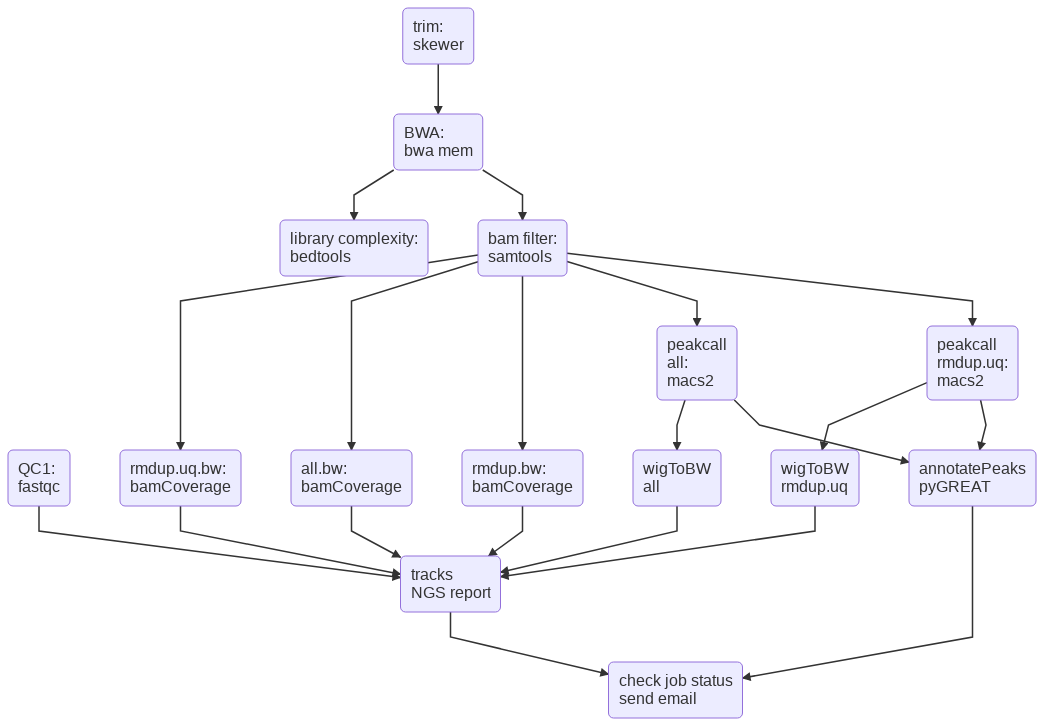
The text file example shown below. See https://mermaidjs.github.io/flowchart.html for syntax.
    graph TD
id1(QC1: fastqc)
id2(trim: skewer) --> id3(BWA: bwa mem)
id3 --> id4(library complexity: bedtools)
id3 --> id5(bam filter: samtools)
id5 --> id6(rmdup.uq.bw: bamCoverage)
id5 --> id7(all.bw: bamCoverage)
id5 --> id8(rmdup.bw: bamCoverage)
id5 --> id9(peakcall all: macs2)
id5 --> id10(peakcall rmdup.uq: macs2)
id9 --> id11(wigToBW all)
id10 --> id12(wigToBW rmdup.uq)
id1 --> id13(tracks NGS report)
id6 --> id13
id7 --> id13
id8 --> id13
id11 --> id13
id12 --> id13
id9 --> id14(annotatePeaks pyGREAT)
id10 --> id14
id14 --> id15(check job status send email)
id13 --> id15
mmdc -i test.md -o test.png -w 1200 -H 1000
Default size is 800 * 600. Output to svg is OK. But text wrapping has some issues. test.png is shown below.