sequence alignment seq + bar plot
usage: seq_bar_svg.py [-h] -i INPUT -o OUTPUT [-t TITLE] [--pam PAM] [--on-target ON_TARGET]

Sequence + sample barplot SVG generator.

Input CSV columns (header required):
  seq          first row is on-target (typically 23bp ending in NGG PAM);
               other rows are off-targets (any length; will be NW-aligned to
               the on-target if length differs from on-target length).
  <sample 1>   numeric value, OR comma/semicolon-separated replicates
               (e.g. "12.3,15.1,11.8") -> mean +/- sd error bar.
  <sample 2>   ...
  ...

Each column after `seq` becomes one bar-plot panel on the right of the
sequence block, in column order. Bars are horizontal, drawn on a log10
x-axis, one bar per off-target row, color-coded per row.

Usage:
  python seq_bar_svg.py -i input.csv -o out.svg -t "BCL2L11_A11_rep1"

optional arguments:
  -h, --help            show this help message and exit
  -i INPUT, --input INPUT
                        Input CSV
  -o OUTPUT, --output OUTPUT
                        Output SVG path
  -t TITLE, --title TITLE
                        Plot title
Summary
Input a csv and generate this image:
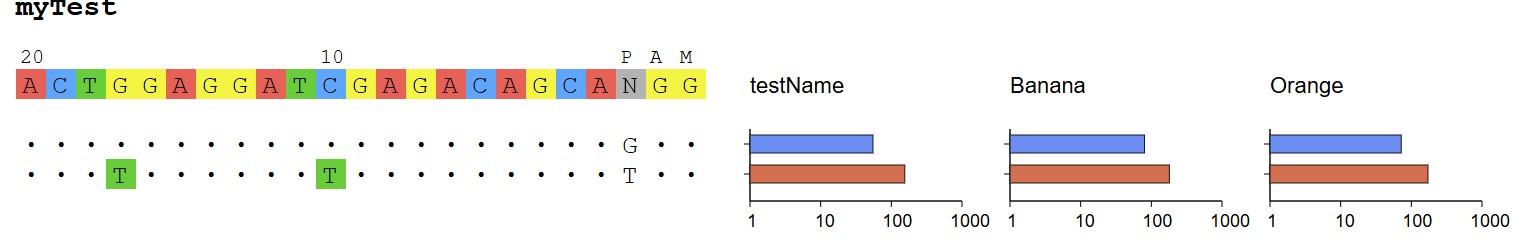
Input
Prepare a csv file with first column is the sequences and the rest columns are values for the bar plot.
anyName(first column always seq| first seq always on-target),testName,Banana,Orange
ACTGGAGGATCGAGACAGCAGGG,55,80,72
ACTTGAGGATTGAGACAGCATGG,155,180,172
Usage
module load conda3/202402

source activate /home/yli11/.conda/envs/jupyterlab_2024

seq_bar_svg.py -i test.csv -o test.svg -t "myTest"