Integrating gene expression data and PPI network
Objective
Our goal is to learn some network modules specific to the given gene expression data. No new PPIs are made by this algorithm.
Steps
graphSage to learn node embeddings
dimension reduction of node embeddings into 2D space (e.g., TSNE, UMAP)
clustering of 2D scatter plot. (e.g., k-means, community detection, louvain)
Cons
Resulted network modules could be unstable since in all three steps (mainly the first step), there are a great amount of randomness.
Results can be used as an exploration. We’ve used it to prodive a motivation to study NFIX and PU.1 co-binding.
Input
Gene expression read count table, CSV
Each row is a gene, each column is a sample.
The first row is column names and the first column is row names.
BIO-GRID txt file
For example, BIOGRID-ALL-4.2.192.tab3.txt
Usage
Step 1: prepare input.list
This is a 3 column tsv with file names of gene.count.csv, biogrid.txt. The last column is output label.
Step 2: submit job
hpcf_interactive

module load python/2.7.13

run_lsf.py -f input.list -p graphSAGE
Output
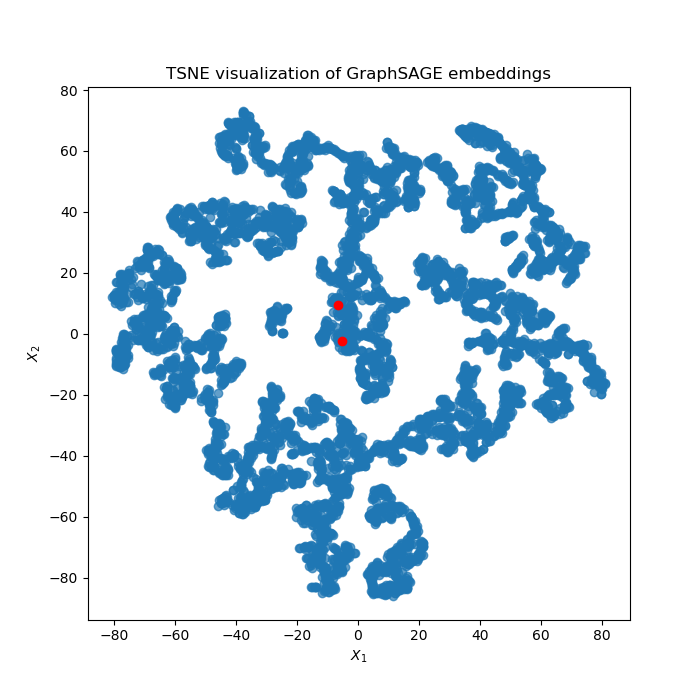
1. TSNE plot of all the nodes
I sometimes run the algorithm multiple times to see if my interested genes can be clustered together.
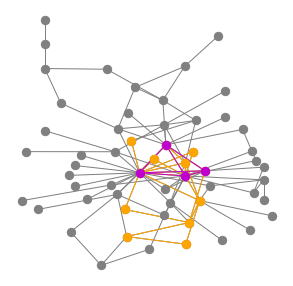
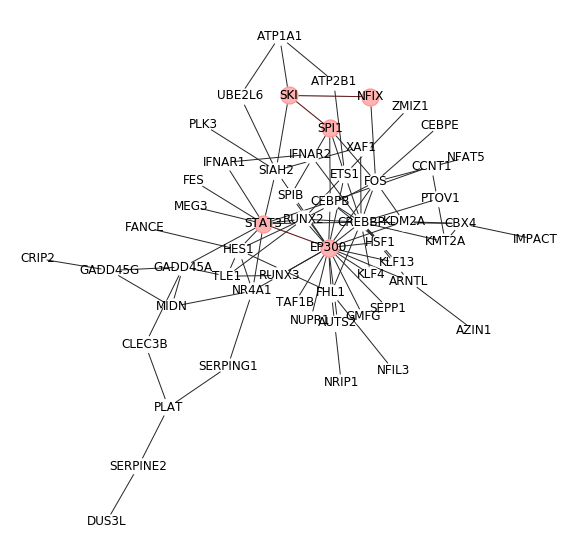
2. network modules with name
This is a raw network plot without cosmetic enhancements.
2. network modules with some highlights
We can highlight our genes of interest manually. (need customized code)