Test differences in number of interactions
usage: overlap_bedpe.py [-h] -p POS_BED -n NEG_BED -f BEDPE [-o OUTPUT]

optional arguments:
  -h, --help            show this help message and exit
  -p POS_BED, --pos_bed POS_BED
                        positive bed file, chr, start, end, etc. (default:
                        None)
  -n NEG_BED, --neg_bed NEG_BED
                        negative bed file, chr, start, end, etc. (default:
                        None)
  -f BEDPE, --bedpe BEDPE
                        bedpe, chr, start, end, chr, start, end, etc.
                        (default: None)
  -o OUTPUT, --output OUTPUT
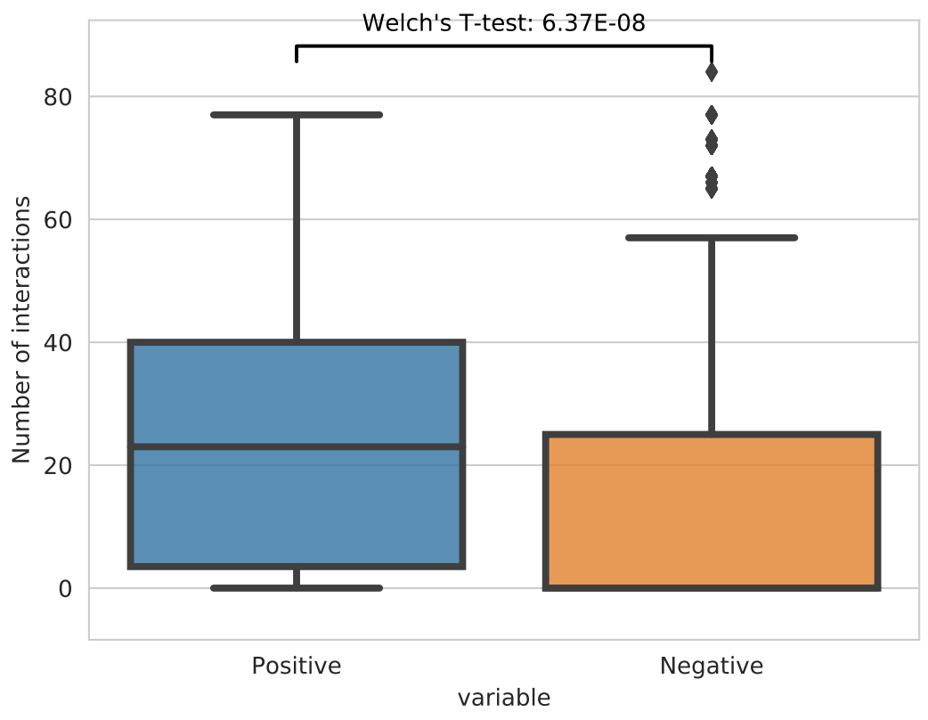
Summary
Given a positive and a negative bed file, get number of interactions for each region in the two bed files and apply welch’s t-test to get the significance.
Example
Input
two bed file and a bedpe file.
Example of bedpe file: only the first 6 columns are used. You might want to first extract significant interactions then perform our analysis.
chr1    62099   63943   chr1    105955  107671  1       0.90552424887951
chr1    105955  107671  chr1    235358  237015  1       0.051453442758473
chr1    712256  716178  chr1    753657  755899  1       0.90552424887951
chr1    712256  716178  chr1    761417  764406  3       0.34819012369507
chr1    712256  716178  chr1    766795  769182  2       0.660667234099137
Output
output.pdf
You can also specify the output file name.
Usage
hpcf_interactive

source activate /home/yli11/.conda/envs/py2/

cd /home/yli11/test/xxx/

overlap_bedpe.py -p pos.bed -n neg.bed -f Hudep2_D0_H3K27AC_HiChIP_FS.interactions.all.mango