Filtering out peaks in narrowPeak files
NarrowPeak format
NAME_peaks.narrowPeak is BED6+4 format file which contains the peak locations together with peak summit, p-value, and q-value. You can load it to the UCSC genome browser. Definition of some specific columns are:

5th: integer score for display. It's calculated as int(-10*log10pvalue) or int(-10*log10qvalue) depending on whether -p (pvalue) or -q (qvalue) is used as score cutoff. Please note that currently this value might be out of the [0-1000] range defined in UCSC ENCODE narrowPeak format. You can let the value saturated at 1000 (i.e. p/q-value = 10^-100) by using the following 1-liner awk: awk -v OFS="\t" '{$5=$5>1000?1000:$5} {print}' NAME_peaks.narrowPeak

7th: fold-change at peak summit

8th: -log10pvalue at peak summit

9th: -log10qvalue at peak summit

10th: relative summit position to peak start
Usage
General approach: filtering out peaks using Fold-change or FC or FDR (``-log10qvalue ``).
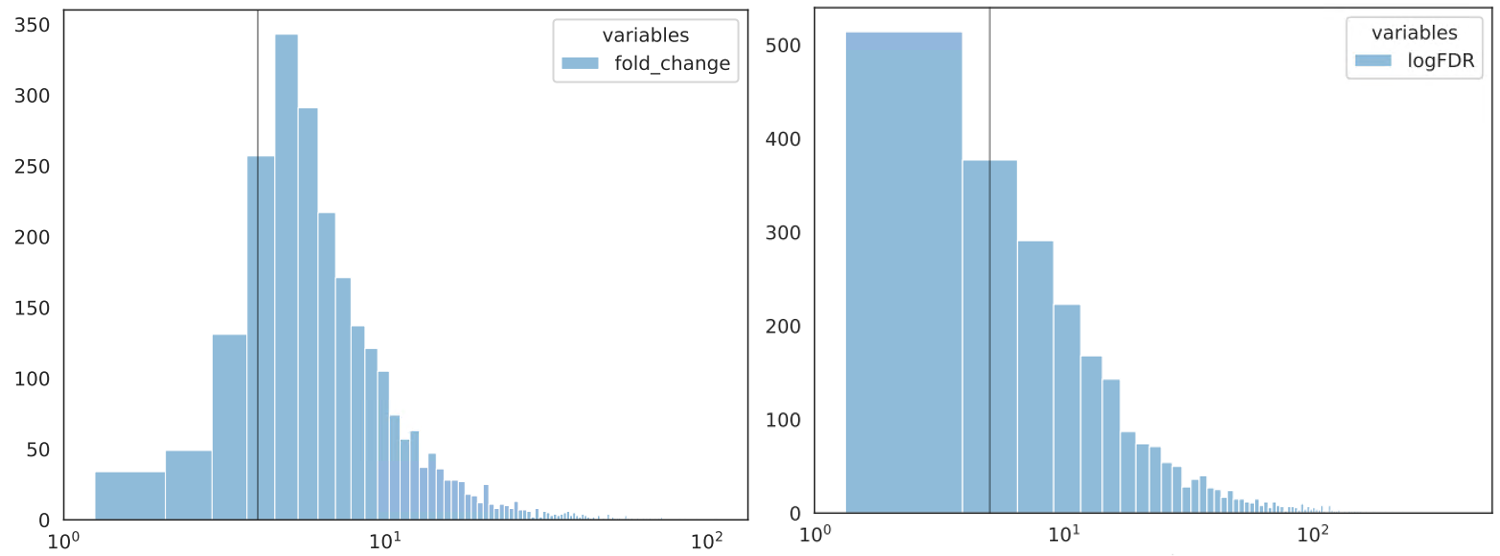
First, let’s take a look on the distribution of FC and FDR.
hpcf_interactive

module load conda3

source activate /home/yli11/.conda/envs/py2

cut -f 7 Donor12_FG4592_ABE801_100uM_S4.vs.CD34_day10_NT_IgG_S11.rmdup.uq.rmchrM_peaks.narrowPeak > tmp.list; histogram_seaborn.py --fold_change tmp.list --axv 4 --xscale_log -o FC.dist

cut -f 9 Donor12_FG4592_ABE801_100uM_S4.vs.CD34_day10_NT_IgG_S11.rmdup.uq.rmchrM_peaks.narrowPeak > tmp.list; histogram_seaborn.py --logFDR tmp.list --axv 5 --xscale_log -o FDR.dist
The grey line (--axv 4) in FC.dist.pdf is fold change = 4.
The grey line (--axv 5) in FDR.dist.pdf is FDR = 1e-5.
Next, based on the distributions, you can then filter narrowPeak files using just Fold Change = 4:
narrowPeak_FC_filter.py xxx.narrowPeak 4
Or, using Fold Change = 6 and -logFDR = 5
narrowPeak_FC_filter.py xxx.narrowPeak 6 5