STARR-seq analysis pipeline
Summary
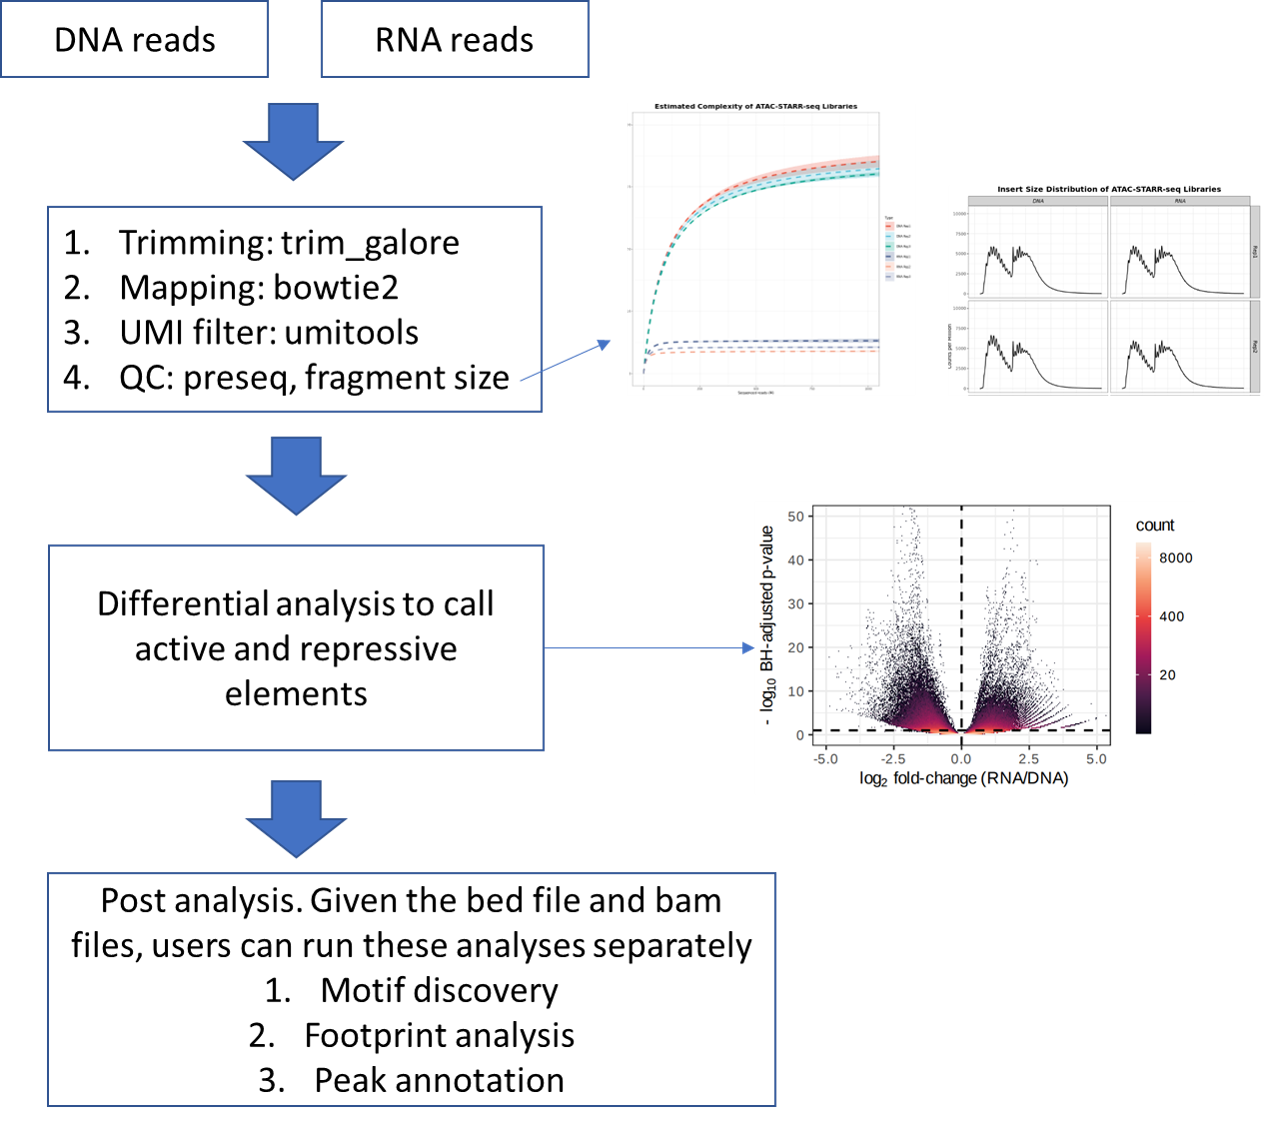
ATAC-STARR-seq is an assay to profile self-transcribed active regions (e.g., enhancer). This pipeline is adopted from Tyler J Hansen 2022, Genome Research paper with minor modifications.
This pipeline assumes both DNA and RNA have UMI.
This pipeline assumes the DNA group and RNA group have equal number of replicates.
(Previous Note) To generate fastq for starr-seq from bcl file
If you already have fastq files, please skip this step.
The UMI should be added to the read name as @oldReadName_UMI.
1. One DNA barcodes and One RNA barcode + DNA UMI and RNA UMI
# login to compute node
hpcf_interactive.sh

module load bcl2fastq

bcl2fastq --no-lane-splitting -o starr_seq_fastq --sample-sheet /home/yli11/HemTools/share/misc/starr_seq_SampleSheet2.csv --create-fastq-for-index-reads

cd starr_seq_fastq
module load conda3/202011
source activate /home/yli11/.conda/envs/captureC
starr_seq_demultiplex2.py AGGCTATA AGGATAGG 1
# DNA barcode, RNA barcode, mismatch cutoff. Please replace barcode sequence with your barcode sequence.
Input
fastq.tsv
Use run_lsf.py --guess_input to automatically generate this. Then you have to manually add a 4th column, with keywords of DNA or RNA.
myDNA1_R1.fastq.gz      myDNA1_R2.fastq.gz      myDNA1  DNA
myDNA2_R1.fastq.gz      myDNA2_R2.fastq.gz      myDNA2  DNA
myRNA1_R1.fastq.gz      myRNA1_R2.fastq.gz      myRNA1  RNA
myRNA2_R1.fastq.gz      myRNA2_R2.fastq.gz      myRNA2  RNA
Note
This pipeline assumes you have equal number of replicates for the DNA group and the RNA group.
Usage
hpcf_interactive

module load python/2.7.13

run_lsf.py --guess_input # to generate fastq.tsv

run_lsf.py -f fastq.tsv -p atac_starr_seq --MAPQ 0 --macs_genome hs -g hg19
For custom genome
run_lsf.py -f fastq.tsv -p atac_starr_seq --MAPQ 0 --macs_genome ESTIMATED_NUM_BP -g custom --bowtie2_index YOUR_PATH

run_lsf.py -f fastq.tsv -p atac_starr_seq --MAPQ 0 --macs_genome 1554000 -g custom --bowtie2_index /home/yli11/Share/Jingjing/GATA1.starr

run_lsf.py -f fastq.tsv -p atac_starr_seq --MAPQ 0 --macs_genome 1130680 -g custom --bowtie2_index /home/yli11/Share/Lanying/unique_combine_lib_final
Applies to any -p pipelines below.
For strand separated results, run:
run_lsf.py -f fastq.tsv -p atac_starr_seq_forward --MAPQ 0 --macs_genome hs -g hg19

run_lsf.py -f fastq.tsv -p atac_starr_seq_reverse --MAPQ 0 --macs_genome hs -g hg19
When using DNA reads without UMI, run:
run_lsf.py -f fastq.tsv -p atac_starr_seq_nodnaumi --MAPQ 0 --macs_genome hs -g hg19
Output
QC html
A QC report will be emailed to you when the job is done.
General mapping stats. Some important QC are shown below.
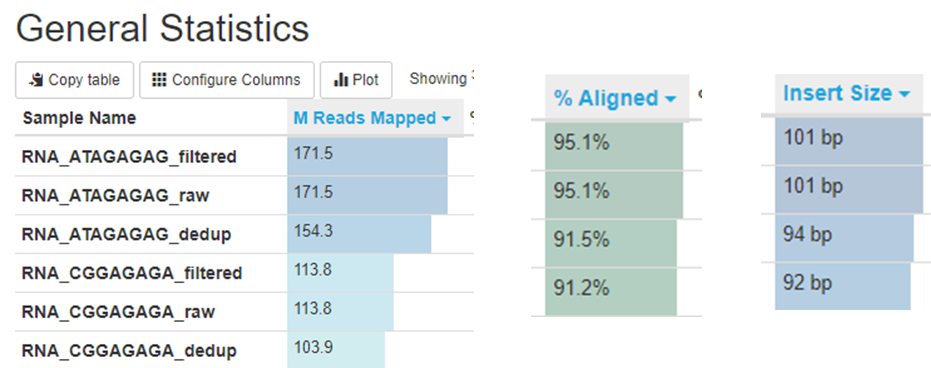
There are many blanks in the table because the QC program extracts text directly from file and usually each file only contain one stat.
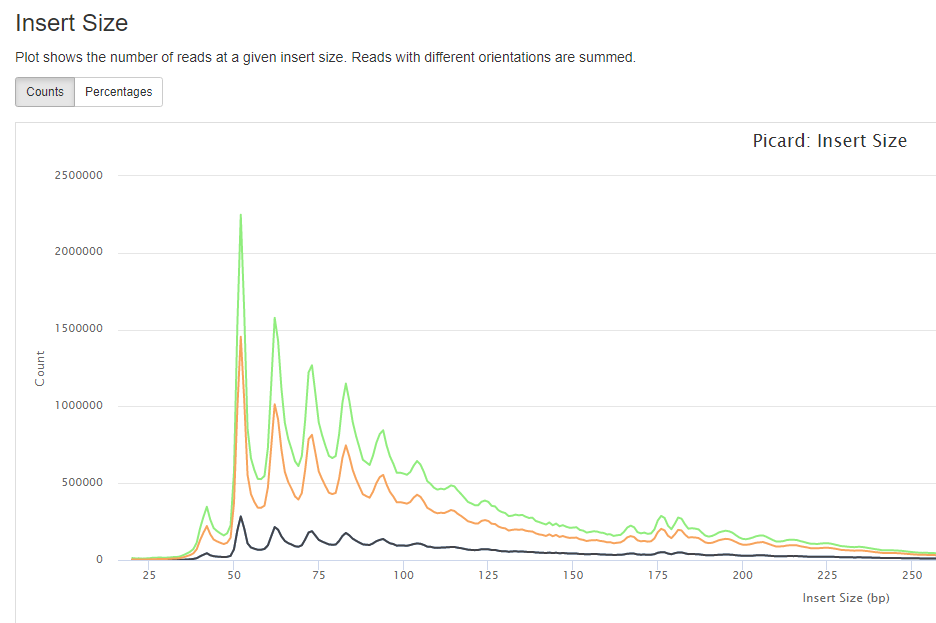
insertion size/ fragment size.
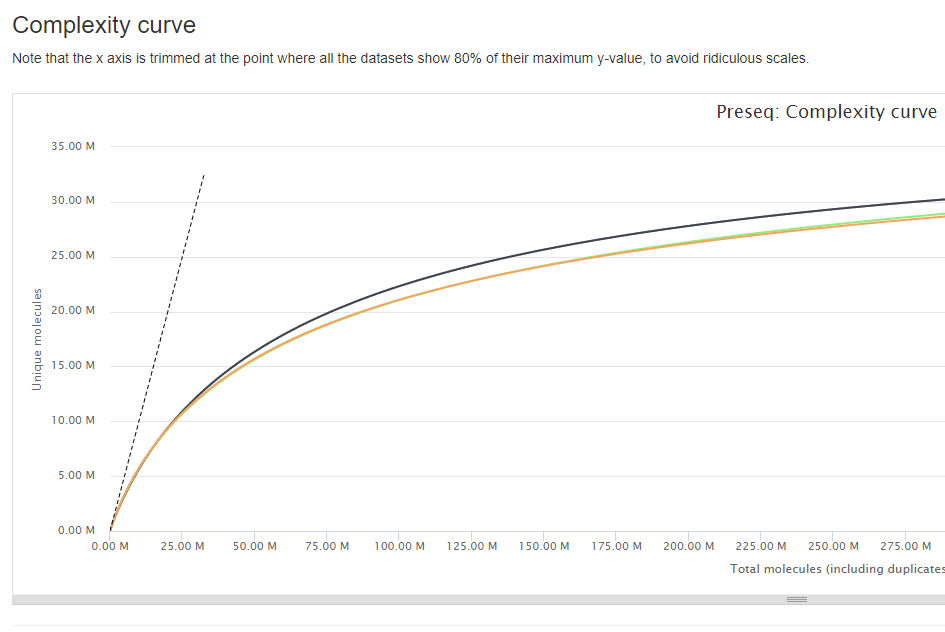
library complexity
Differential analysis
This is the main result.
Take a look at the diff_analysis_plots.html file inside the Differential_analysis.
This html provides a volcano plot (the file is volcano.pdf), correlation plots (corr_R1-R2.pdf), number and size disitribution of active/silent elements bins_donut.pdf / regulatory-regions_size_distribution.pdf, and number of active/silent peaks peaks_donut.pdf.
Active and Silent regions
Use silent_regions.bed and active_regions.bed. The program create 50bp overlapping bins to define region. So these regions are merged from those bins.
Use *peak.bed for peak level annotation.
fold change bw files
DESEQ outputs can also be viewed as bw files. Please go to the bdg_to_bw* folder inside the Differential_analysis.
Active and Silent peaks
#get counts
ChrAcc='../Merged_peaks.rmblck.narrowPeak'

#print number of chracc peaks
system(paste0("wc -l ",ChrAcc),intern = TRUE)
#intersect peaks with active regions and print line number
system(paste0("bedtools intersect -u -a ",ChrAcc," -b active_regions.bed > active.peak.bed"),intern = TRUE)
#intersect peaks with silent regions and print line number

system(paste0("bedtools intersect -u -a ",ChrAcc," -b silent_regions.bed > silent.peak.bed"),intern = TRUE)
#intersect peaks with overlapping active and silent regions and print line number

system(paste0("bedtools intersect -u -a ",ChrAcc," -b active_regions.bed | bedtools intersect -u -a - -b silent_regions.bed > both.peak.bed"),intern = TRUE)
#report peaks that do not intersect active or silent regions and print line number

system(paste0("bedtools intersect -v -a ",ChrAcc," -b active_regions.bed | bedtools intersect -v -a - -b silent_regions.bed > neutral.peak.bed"),intern = TRUE)
active.peak.bed is any peaks overlapped with active.
silent.peak.bed is any peaks overlapped with silent.
active.peak.bed may overlap with both.peak.bed, silent.peak.bed may overlap with both.peak.bed