RNA-seq: Transcript-level quantification
usage: HemTools rna_seq [-h] [-j JID] [--debug] [--short]
                        (-f INPUT | --guess_input) [-g GENOME] [-i INDEX_FILE]
                        [-b BLACKLIST] [-s CHROM_SIZE]
                        [-e EFFECTIVEGENOMESIZE]
Named Arguments
- -j, --jid
enter a job ID, which is used to make a new directory. Every output will be moved into this folder.
Default:
'{{subcmd}}_docs_2026-04-30'- --debug
Not for end-user.
Default:
False- --short
Not for end-user.
Default:
False- -f, --input
tab delimited 3 columns (tsv file): Read 1 fastq, Read 2 fastq, sample ID
- --guess_input
Let the program generate the input files for you.
Default:
False
Genome Info
- -g, --genome
genome version: hg19, hg38, mm9, mm10
Default:
'hg19'- -i, --index_file
STAR index file
Default:
'/home/docs/checkouts/readthedocs.org/user_builds/hemtools/checkouts/latest/subcmd/../hg19/hg19_star_253a_index/'- -b, --Blacklist
Blacklist file
Default:
'/home/docs/checkouts/readthedocs.org/user_builds/hemtools/checkouts/latest/subcmd/../hg19/hg19.blacklist.bed'- -s, --chrom_size
chrome size
Default:
'/home/docs/checkouts/readthedocs.org/user_builds/hemtools/checkouts/latest/subcmd/../hg19/hg19.chrom.sizes'- -e, --effectiveGenomeSize
effectiveGenomeSize for bamCoverage
Default:
'2451960000'
Summary
This pipeline quantifies transcript-level abundance using kallisto and generates bam, bw files using STAR. The output file kallisto_files/{jid}_transcript.tpm.csv contains both transcript ID and gene name, which users can look for specific genes. For differential gene/transcript expression analysis, see diff_genes. For volcano plot of differential genes, see volcano. For RNA-seq variant calling, see rna_seq_variant_call
3/14/2024 Update
Isoform quantification using STAR is added. The transcript count table is *.isoforms.results.
To visualize read assigned to a transcript
First, get the transcript ID from the transcript count table.
Then, do
module load samtools/1.7;samtools view Your_label.transcript.bam | grep Your_transcript_ID | cut -f 1 > read.list

# the bam file should be in your bam_files folder, use markdup.uq.bam file
# Please note that transcript.bam is different than markdup.uq.bam

module laod picard/2.9.4;java -jar /hpcf/apps/picard/install/2.9.4/picard.jar FilterSamReads I=YOUR_bam_file.markdup.uq.bam O=subset.bam READ_LIST_FILE=read.list FILTER=includeReadList Validation_Stringency=SILENT;samtools index subset.bam
Usage
Go to your data directory and type the following.
Step 0: Load python version 2.7.13.
$ module load python/2.7.13
Step 1: Prepare input files, generate fastq.tsv.
$ HemTools_dev rna_seq --guess_input

    Input fastq files preparation complete! ALL GOOD!
    Please check if you like the computer-generated labels in : fastq.tsv
Note
If you are preparing fastq.tsv yourself, please make sure no space anywhere in the file. Note that the seperator is tab. Spaces in file name will cause errors.
Step 2: Check the computer-generated input list (manually), make sure they are correct.
$ less fastq.tsv
Note
a random string will be added to the generated files (e.g., fastq.94c049cbff1f.tsv) if they exist before running step 1.
Step 3: Submit your job.
$ HemTools_dev rna_seq -f fastq.tsv
Single-end input
The input is the same, leave the second column empty.
$ HemTools_dev rna_seq -f fastq.tsv --single
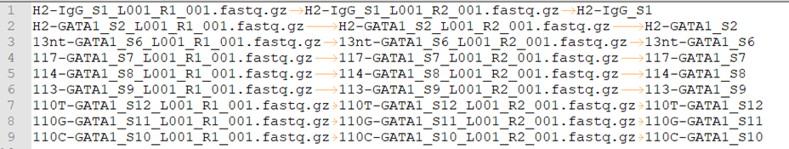
Sample input format
fastq.tsv
This is a tab-seperated-value format file. The 3 columns are: Read 1, Read 2, sample ID.
Common downstream analyses
differential expression analysis (transcript / gene level)
MA plot, volcano plot, heatmap
given a set of genes, show a boxplot / violin plot (gene counts, TPM, or other quantifiers)
gene set enrichment analysis
Paired-end sequencing allows for various of additional analyses, including
isoform specific expression / differential isoform usage / alternative splicing / cryptic exons
RNA editing / variant calling / allel-specific expression
gene fusion
If a large collection of RNA-seq data is available, one can perform clustering analysis, time-series analysis, infering biological network, and classification analysis.
Integrative analyses with other data, etc ChIP-seq, ATAC-seq.
Output
In the email, you will see a zip file containing transcript expressions (TPM) for all input samples. An analysis report is also attached (same format as other reports generated by HemTools). Since STAR doesn’t include un-mapped reads in the bam file, you will see 100% mapping rate. The mapping statistics generated by STAR are currently not included, you can manually “less” them; they are located in the log_files folder, with file name ending with {{output_name}}_Log.final.out.
Reference
https://hbctraining.github.io/Intro-to-rnaseq-hpc-O2/lessons/04_alignment_quality.html
Report bug
Once the job is finished, you will be notified by email with some attachments. If no attachment can be found, it might be caused by an error. In such case, please go to the result directory (where the log_files folder is located) and type:
$ HemTools report_bug
Comments
code @ github.